When you click on links to various merchants on this site and make a purchase, this can result in this site earning a commission. Affiliate programs and affiliations include, but are not limited to, the eBay Partner Network.
Early 99 still has oil pressure instability, and if you don't have the UAOS and the IMS solution, you are still far from "safe" IMHO
completely agree. I don�t track my car even thou I take it supersonic and bust the tower every time I take it out. We tested my aos on Tuesday and it is in great shape. Sometime in the future I�ll be fixing that.
completely agree. I don�t track my car even thou I take it supersonic and bust the tower every time I take it out. We tested my aos on Tuesday and it is in great shape. Sometime in the future I�ll be fixing that.
I have come to the conclusion that 996 owners are the most procrastinating people on earth..lol
I think I remember saying that lower oil temperatures were the key about 3 dozen pages back. I learned that 15+ years ago.
Glad to see that you guys learned that for yourselves.
It would be very helpful if you could let the forum know how you configure your track/race engines to circumvent the high oil temps, would save a lot of people a lot of time!
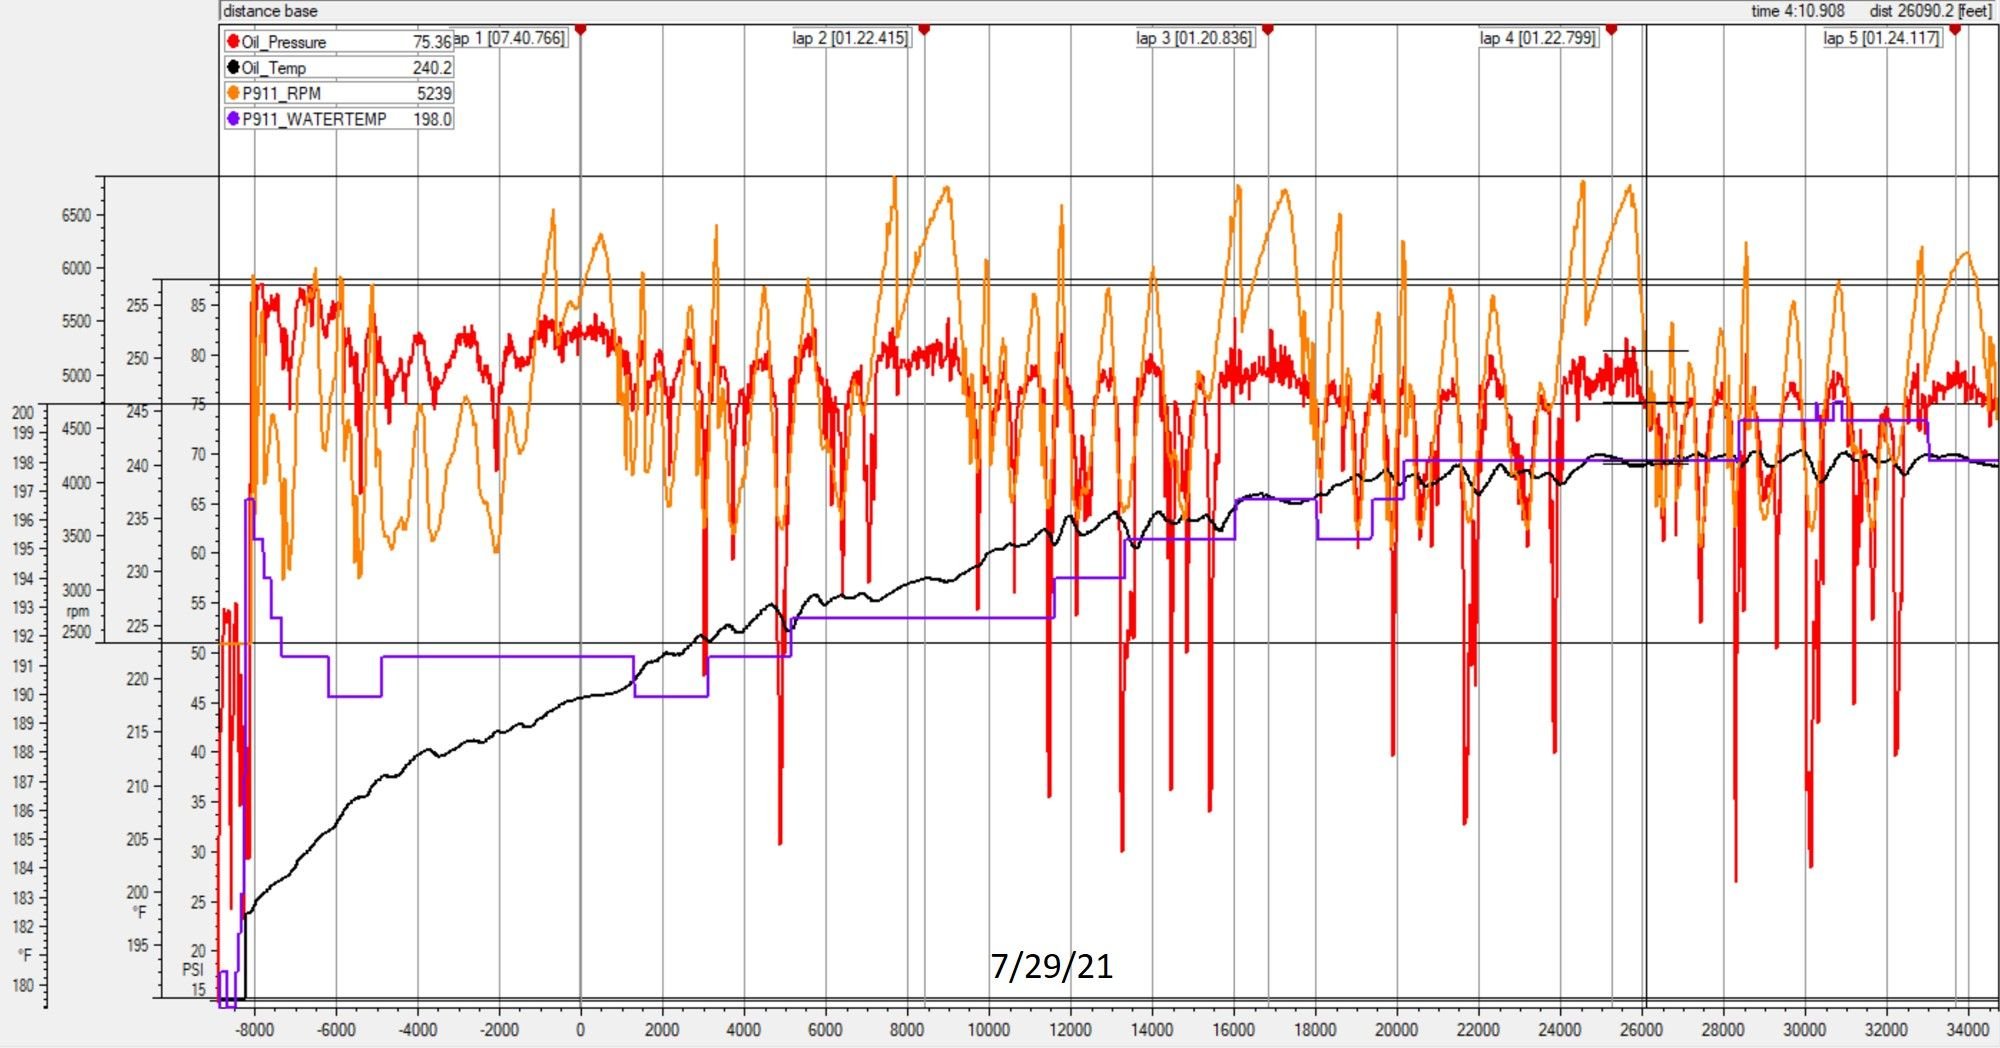
First: Overview chart from 7/29. Plotted v distance instead of time. This is different from previous overview charts but spreads the data uniformly for pressure change comparisons
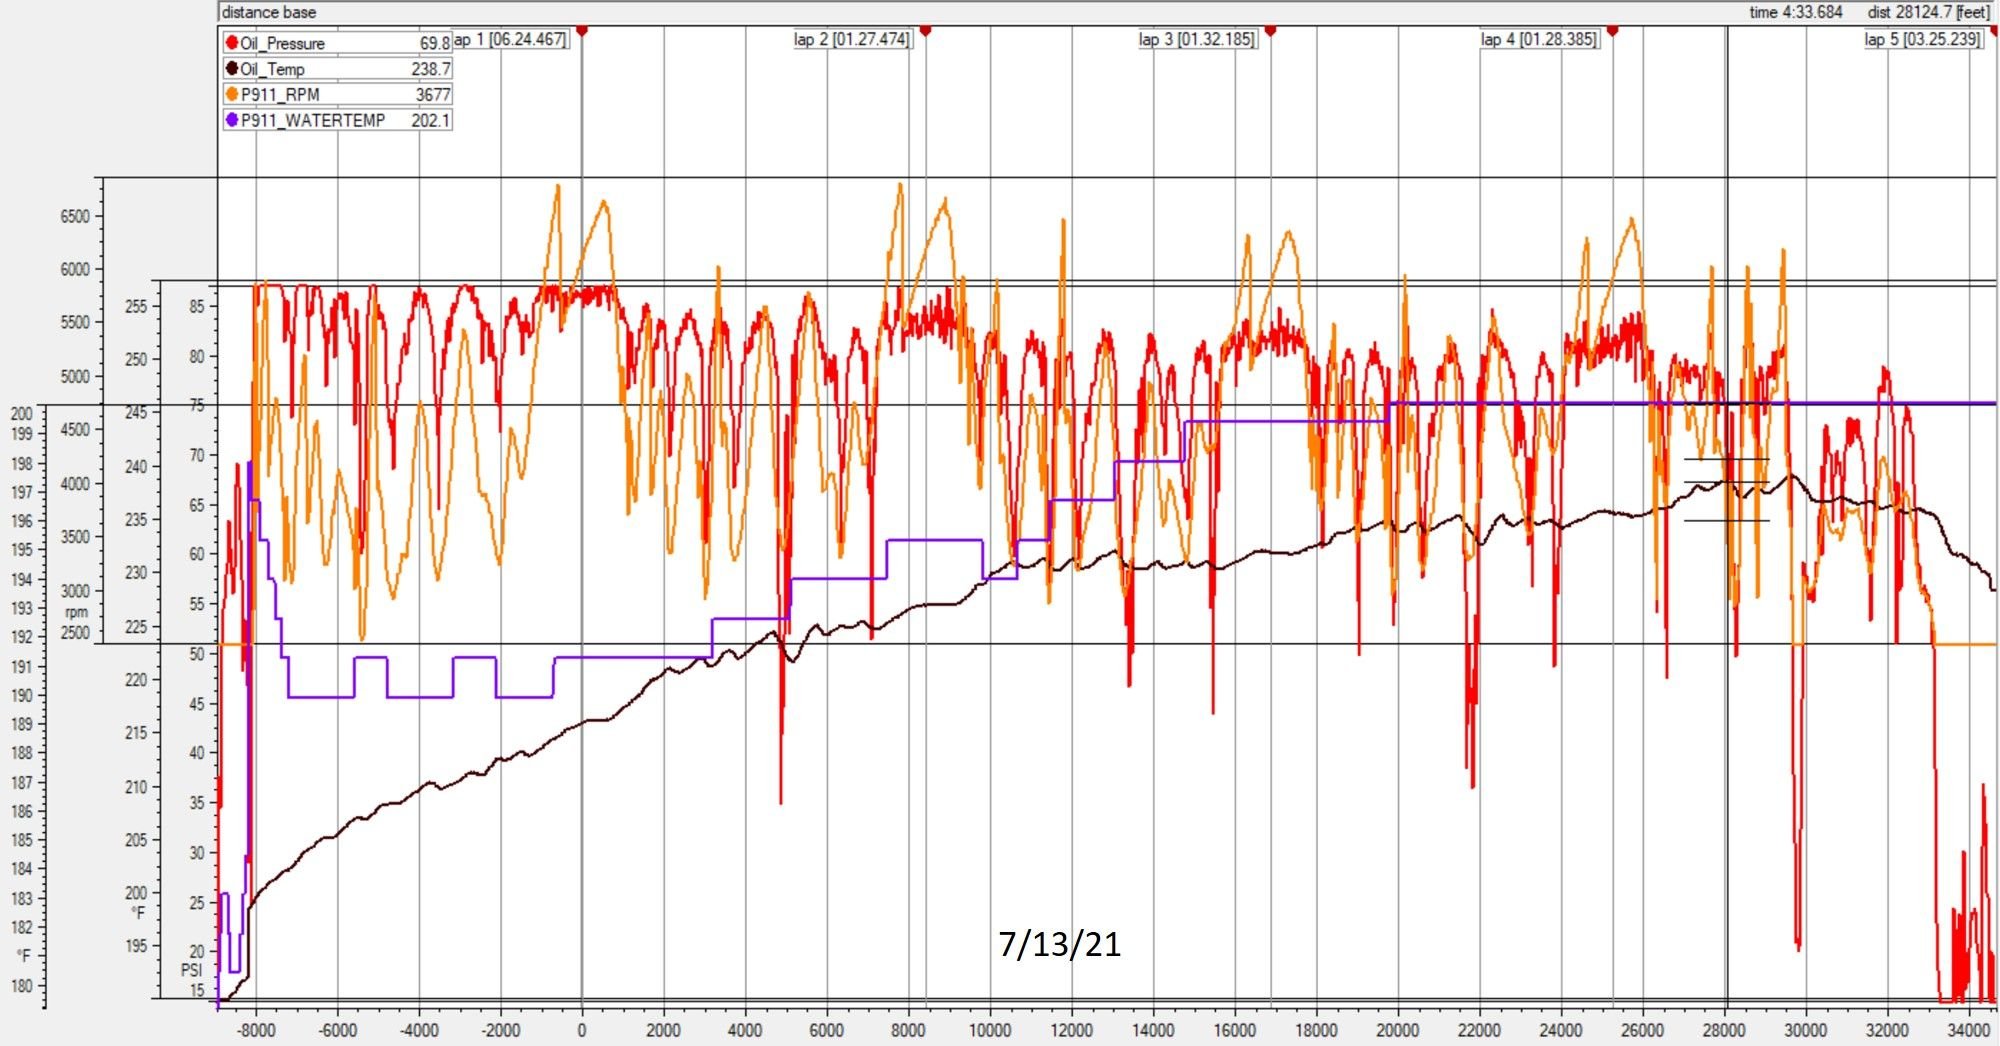
Second: Overview chart from 7/13. Plotted the same way for comparison. Oil temp is a touch cooler, overall pressure is higher, revs are lower, number of pressure drops is significantly less
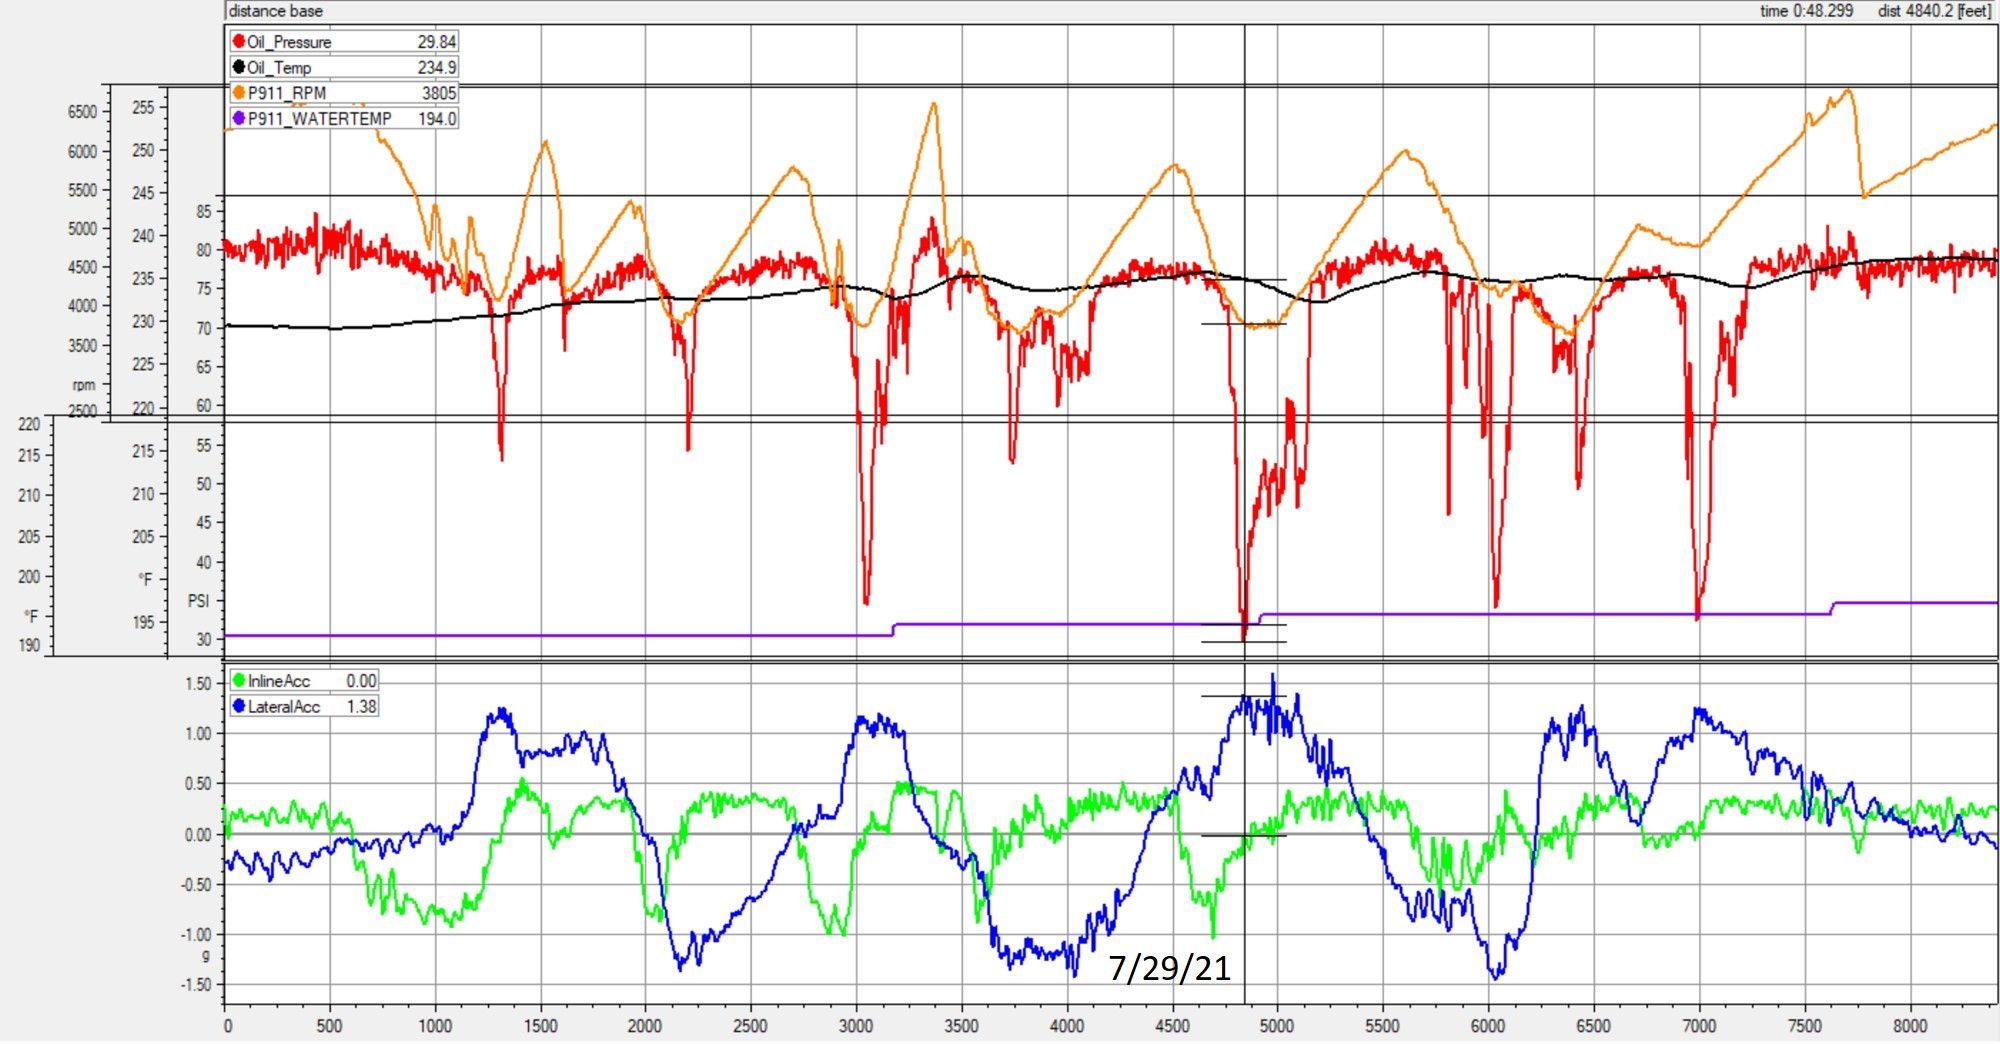
Third: Focus on Personal Best lap from 7/29: more pressure drops than 7/13, but OMG, look at the G's!!!
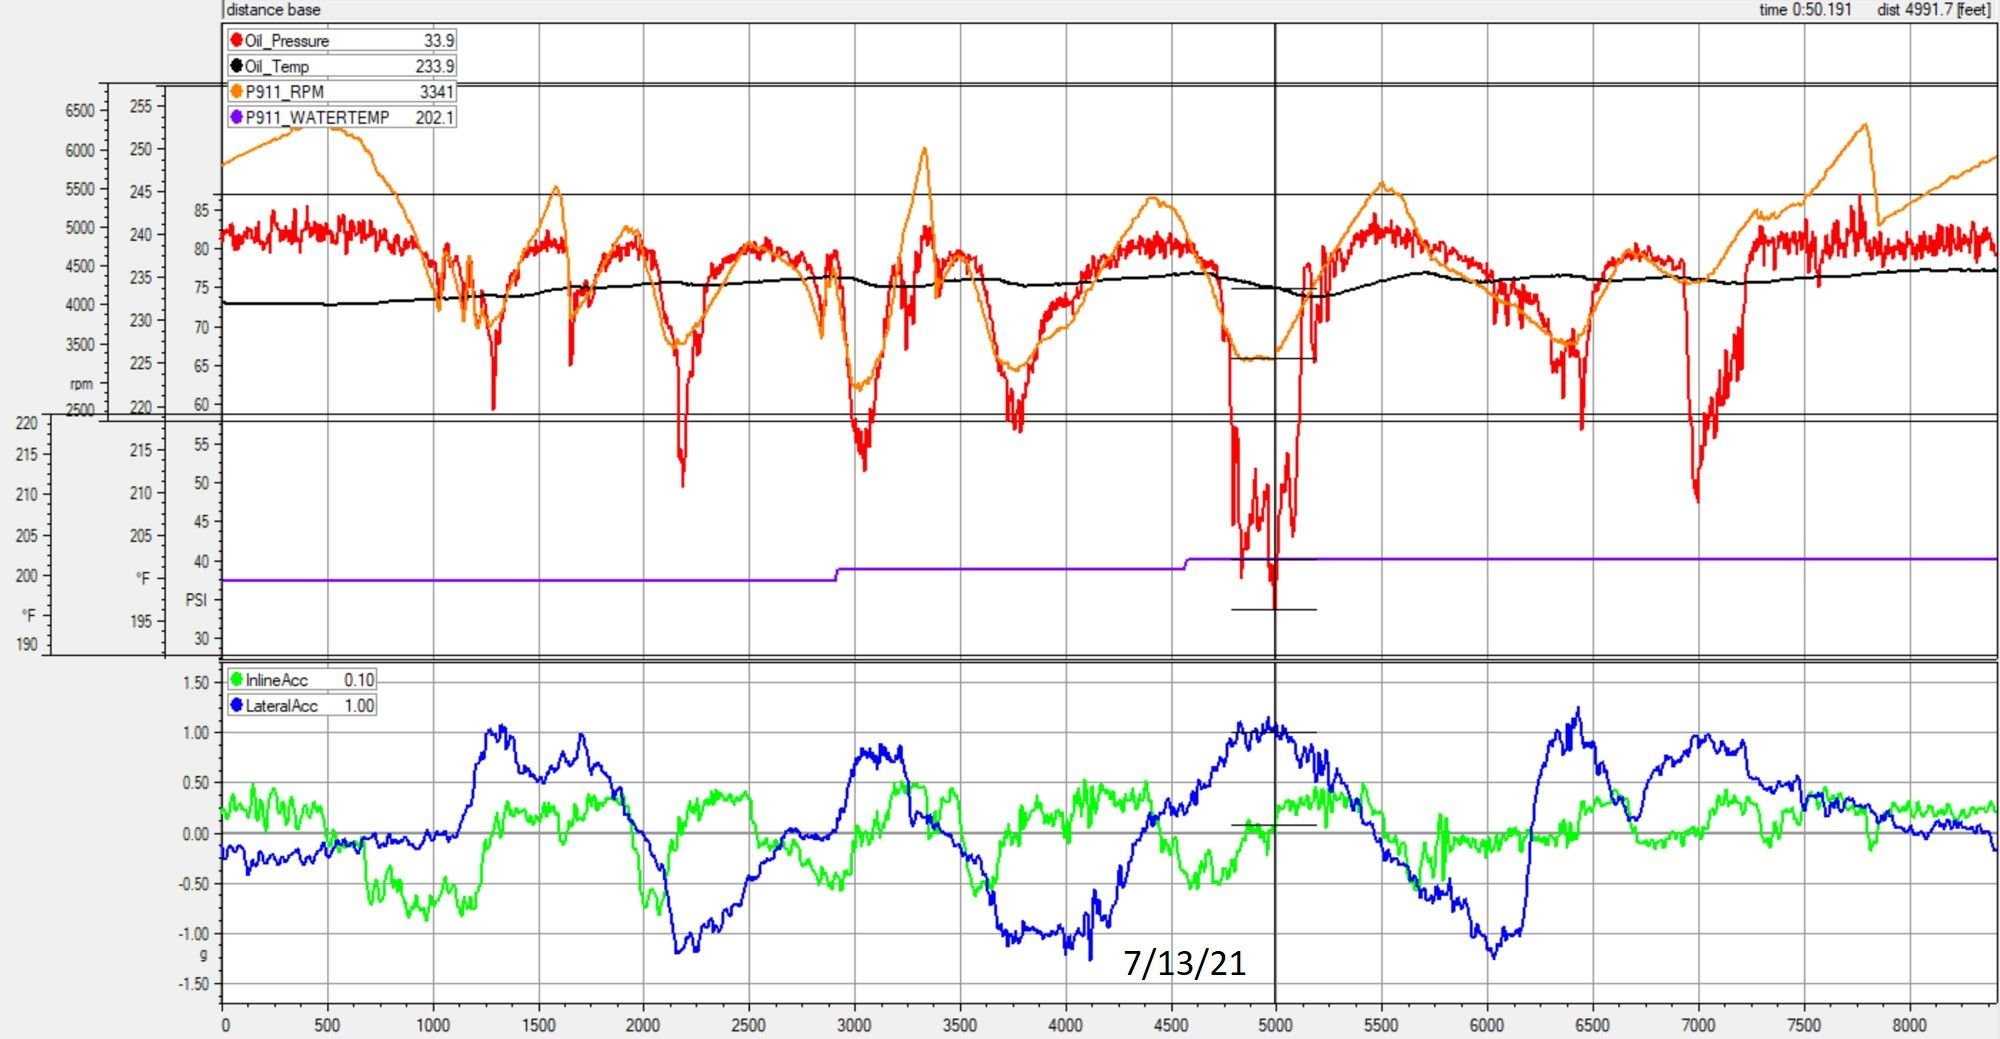
Fourth: Focus on Fastest 'wet' lap from 7/13 with same oil temp at 7/29
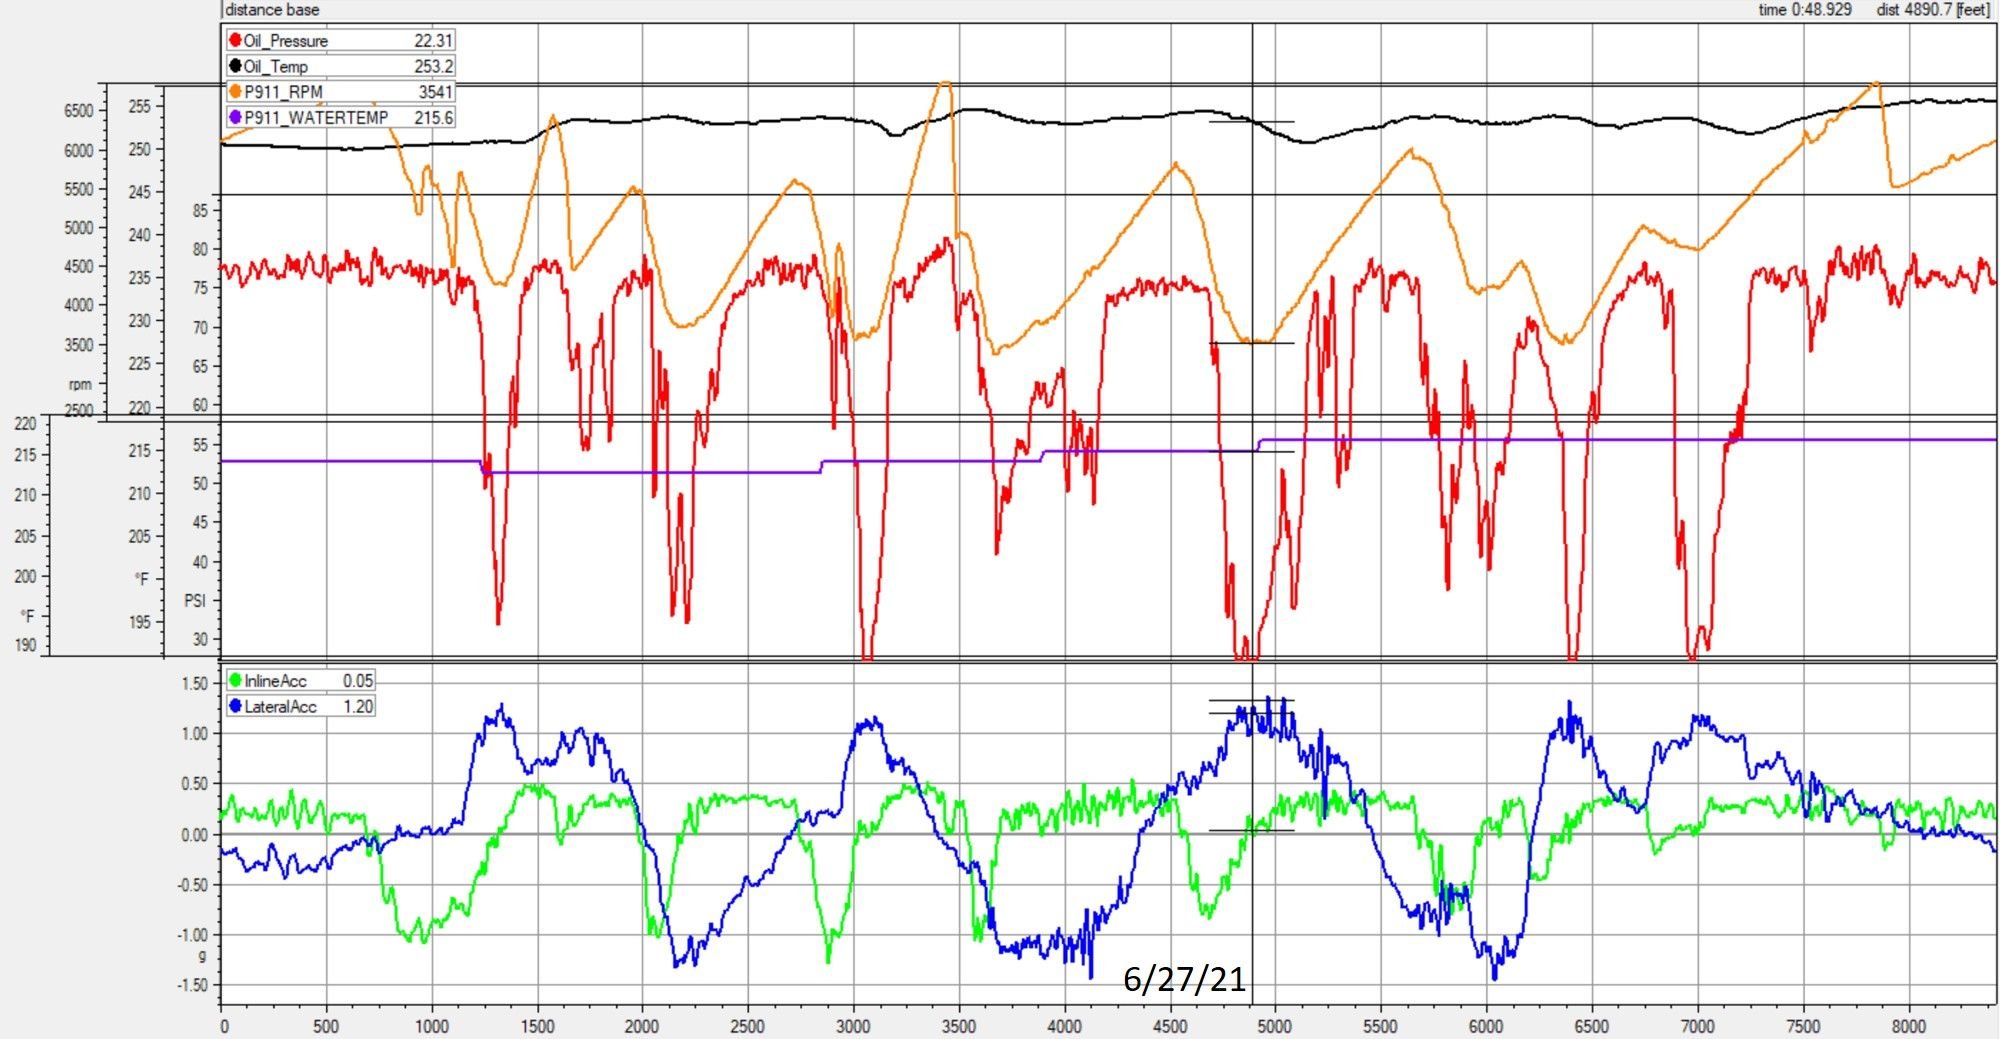
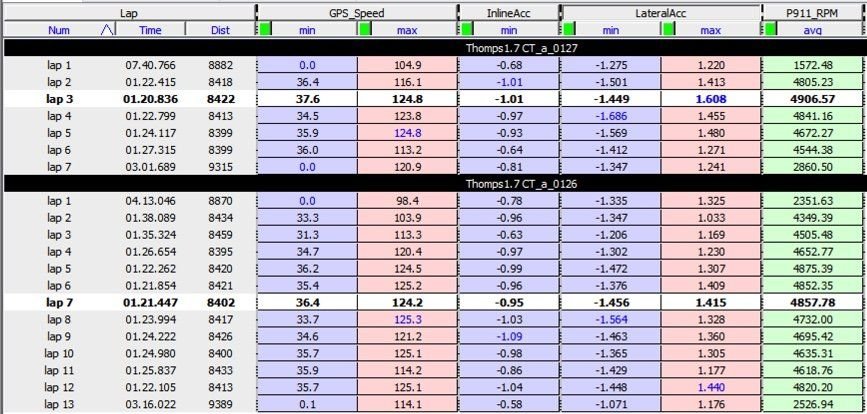
Fifth: Focus on Previous Personal Best lap from 6/27:
Lap 3 is the personal best lap. Water temps around 199, cooler than other charts here. UAOS with Track Drain, 3/4 range on dipstick, no fan on 1 rad, opening cut in wheel well to help airflow through wheel wells. Higher G's in turns easily explain more pressure drops that 7/13 session.
Rainy session. Slightly cooler oil temps to previous chart. Water temp ends at 205(max range on chart is 200, charting error) G's are lower due to wet track, and pressure drops are smaller as well. RPM's are not as high. Overall oil pressure is higher. The curious thing here is that water temp is higher but oil temp is lower than the 7/29 session. I believe this is due to engine load. This session was not run as hard due to the wet track. So even though the water temp is higher, the engine is not dumping as much heat into the oil. UOAS with Track Drain. 1/2 range oil on dipstick. Before removing one fan and opening wheel well.
Third chart: Lap 3 from 7/29 session: engine temp ~232
Fourth chart: From 7/13 session, similar oil temp ~233
Fifth chart: PPB, hot ambient, hot engine 250-255
The story remains consistent. Cooler oil temps decrease pressure drops. Higher G's increase pressure drops. Not sure that adding oil from 1/2 to 3/4 on dipstick improved pressure drops. Higher G's may be obscuring this effect.
My vote on next steps remains the same:
-5w50 oil
-3rd radiator
-Bigger oil to water heat exchanger
Third: Focus on Personal Best lap from 7/29: more pressure drops than 7/13, but OMG, look at the G's!!!
Lap 3 is the personal best lap. Water temps around 199, cooler than other charts here. UAOS with drainback, 3/4 range on dipstick, no fan on 1 rad, opening cut in wheel well to help airflow through wheel wells. Higher G's in turns easily explain more pressure drops that 7/13 session.
Third chart: Lap 3 from 7/29 session: engine temp ~232
Forward comments and questions.
I'd like to focus on this lap for a moment. I'm going to put the track map in here so people who haven't been to this track can see the track layout.
The oil pressure drops obviously coincide with the turns. The time from the graph is in square brackets.
Turn 1 [1400]: after heavy braking it's a sharp right hander (120 deg) that's very slow, and back on the gas right away after turn in.
Turn 2 [1600]: quick right hander (60 deg) that's probably run at WOT. Shift to third in there somewhere. This is really a continuation of Turn 1 and is essentially a single increasing radius turn with a little kink on the end.
Turn 3 [2200]. A sharp left hander (90 deg) with good camber so it's pretty fast.
Turn 4 [3100]: A hard right hairpin (180 deg) that's slightly off camber so it's fairly slow.
Turn 5 & 6 [3600-4300]: A wide left hander (180 deg) that's flat. maintenance throttle is typical. It's doable as a double apex or as a long carousel.
Turn 7 & 8 [4900-5100]: A wide fast right hander (180 deg) that's slightly banked. This is one end of the small banked oval. I consider this one a carousel too.
Turn 9. [5800-6100] decreasing radius left hander (110 deg), very bumpy
Turn 10 [6500]. off camber right hander (110 deg)
Turn 11 [6900-7100] fast uphill right hander (90 deg) that sets up the main straight.
I think it's plainly obvious that right hand turns are the issue, longer right hand turns being more of an issue! The fast right hand 7-8 complex run at relatively low rpm is of interest. The high G at turn in combined with low rpm causes the huge drop. The slight relaxation of G towards the end combined with increasing rpm brings the oil pressure right back up.
The fast turn 10 also shows a big oil pressure drop, which again recovers after slight relaxation of G and increasing rpm.
The other point of interest is the drop in turn 9, which is a left hander that's bumpy and under heavy braking. This is the only significant pressure drop in a left hander.
A final observation, the oil pressure doesn't go below 30-ish PSI. Also the largest oil pressure drops are with the engine under maintenance throttle or under coasting or braking, with much less load than hard acceleration. It appears to me that the initial "slosh" of oil on right hand turn-in precipitates the pressure drop and once the G load is set up a steady state occurs with lower than desirable but still OK oil pressure. This appears in the turn 7-8 complex. There is not enough time spent turning in turn 4 to set up a steady state, although the beginning of a steady state condition can be seen.
First: Overview chart from 7/29. Plotted v distance instead of time. This is different from previous overview charts but spreads the data uniformly for pressure change comparisons
Second: Overview chart from 7/13. Plotted the same way for comparison. Oil temp is a touch cooler, overall pressure is higher, revs are lower, number of pressure drops is significantly less
Third: Focus on Personal Best lap from 7/29: more pressure drops than 7/13, but OMG, look at the G's!!!
Fourth: Focus on Fastest 'wet' lap from 7/13 with same oil temp at 7/29
Fifth: Focus on Previous Personal Best lap from 6/27:
Lap 3 is the personal best lap. Water temps around 199, cooler than other charts here. UAOS with drainback, 3/4 range on dipstick, no fan on 1 rad, opening cut in wheel well to help airflow through wheel wells. Higher G's in turns easily explain more pressure drops that 7/13 session.
Rainy session. Slightly cooler oil temps to previous chart. Water temp ends at 205(max range on chart is 200, charting error) G's are lower due to wet track, and pressure drops are smaller as well. RPM's are not as high. Overall oil pressure is higher. The curious thing here is that water temp is higher but oil temp is lower than the 7/29 session. I believe this is due to engine load. This session was not run as hard due to the wet track. So even though the water temp is higher, the engine is not dumping as much heat into the oil. UOAS with drain back. 1/2 range oil on dipstick. Before removing one fan and opening wheel well.
Third chart: Lap 3 from 7/29 session: engine temp ~232
Fourth chart: From 7/13 session, similar oil temp ~233
Fifth chart: PPB, hot ambient, hot engine 250-255
The story remains consistent. Cooler oil temps decrease pressure drops. Higher G's increase pressure drops. Not sure that adding oil from 1/2 to 3/4 on dipstick improved pressure drops. Higher G's may be obscuring this effect.
My vote on next steps remains the same:
-5w50 oil
-3rd radiator
-Bigger oil to water heat exchanger
Forward comments and questions.
Paul, nice work.
Questions to all.
1. Does a CSF radiator actually add any more cooling than a stock radiator? Advertisements suggest 10-20% more cooling.
2. In addition, how much does a third radiator add towards cooling?
3. LN/Charles is working on the bracket for the oil cooler. George was offering his expertise. Any news from Charles or George?
As food for thought, it may be time to open the Go-Fund-Me account again to test a 3rd radiator or test an oil cooler. I am in if Jason and readers are open too it.
well that pretty much sums up my 996.2 going on track any time soon.. unless i can find a track where I only make left hand turns LOL.. joking .. maybe .. So my comment above about the CSF radiators is 100% legit and I will be doing that next.. 3 CSF radiators, LN thermostat, and new water pump happening next as I wait for the new sump and testing..
I don't want to start a radiator war. If the csf radiators are the same size as the stockers they will be within a few % of the stock rad efficiency. The csf may last longer as they're all welded aluminum instead of crimped onto plastic end tanks. The biggest improvement will be to have clean radiators without clogged fins. This may negate the longevity of an all welded aluminum rad, as it will get clogged just like the stockers and need replacement on a similar schedule.
If csf has managed to shoehorn a bigger rad into the same space then it's worth a look. The rad thickness may or may not improve efficiency depending on a host of design choices so I would not base a decision on that alone. Certainly making the length and width larger would improve efficiency. The aluminum end tanks will slightly improve efficiency too.
It would be nice for this test if we had a real hot day. That has not happened so far this year.
Any benefit to using turbo, C4S or Turbo radiator assuming they fit?

 07-30-2021 | 07:39 PM