When you click on links to various merchants on this site and make a purchase, this can result in this site earning a commission. Affiliate programs and affiliations include, but are not limited to, the eBay Partner Network.
Anyone want to believe the second Dyno graph? That's a minimum of a 100hp flywheel gain, from some pretty simple changes. (From another point of view, it's a GT with 400 more cc's and headers.)
But, but, but...it's from a Dynojet. It has to be correct!
Bullsh!t.
I have more of these absurd dyno results:
However, I rest my case.
Boom.
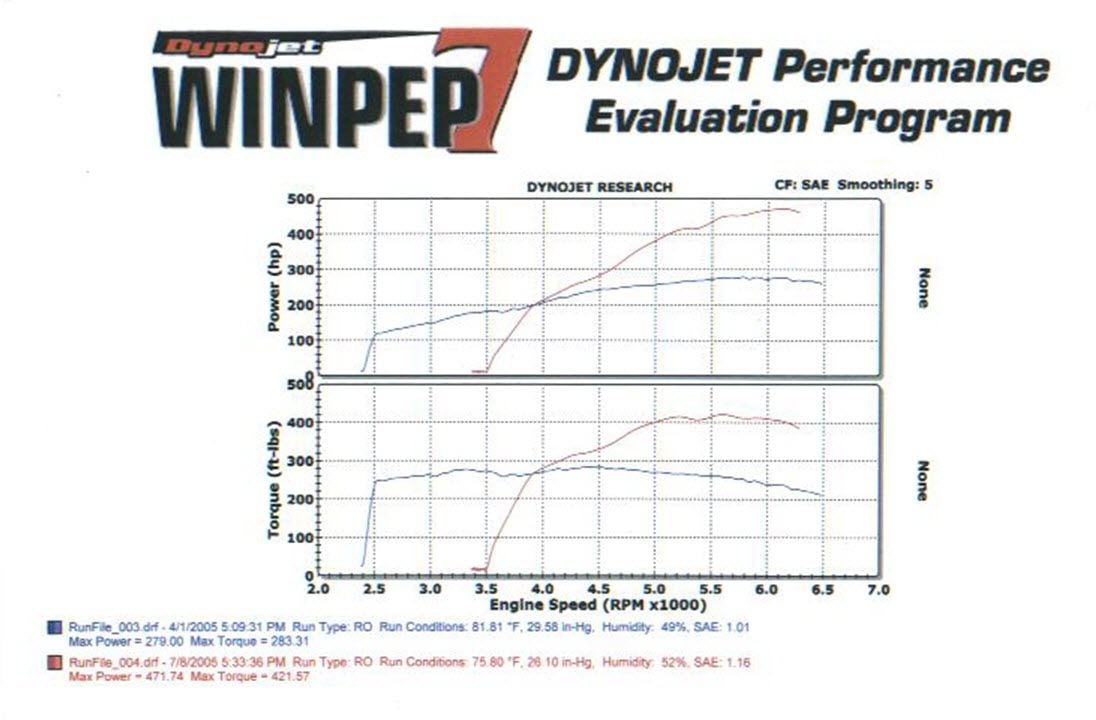
Greg, this is super-easy - what is the correction factor on the second run?
...BOOM!
Additionally, do you really think anyone is going to take that run seriously?
Everyone knows a GTS modded like that will run 335-ish rwhp.
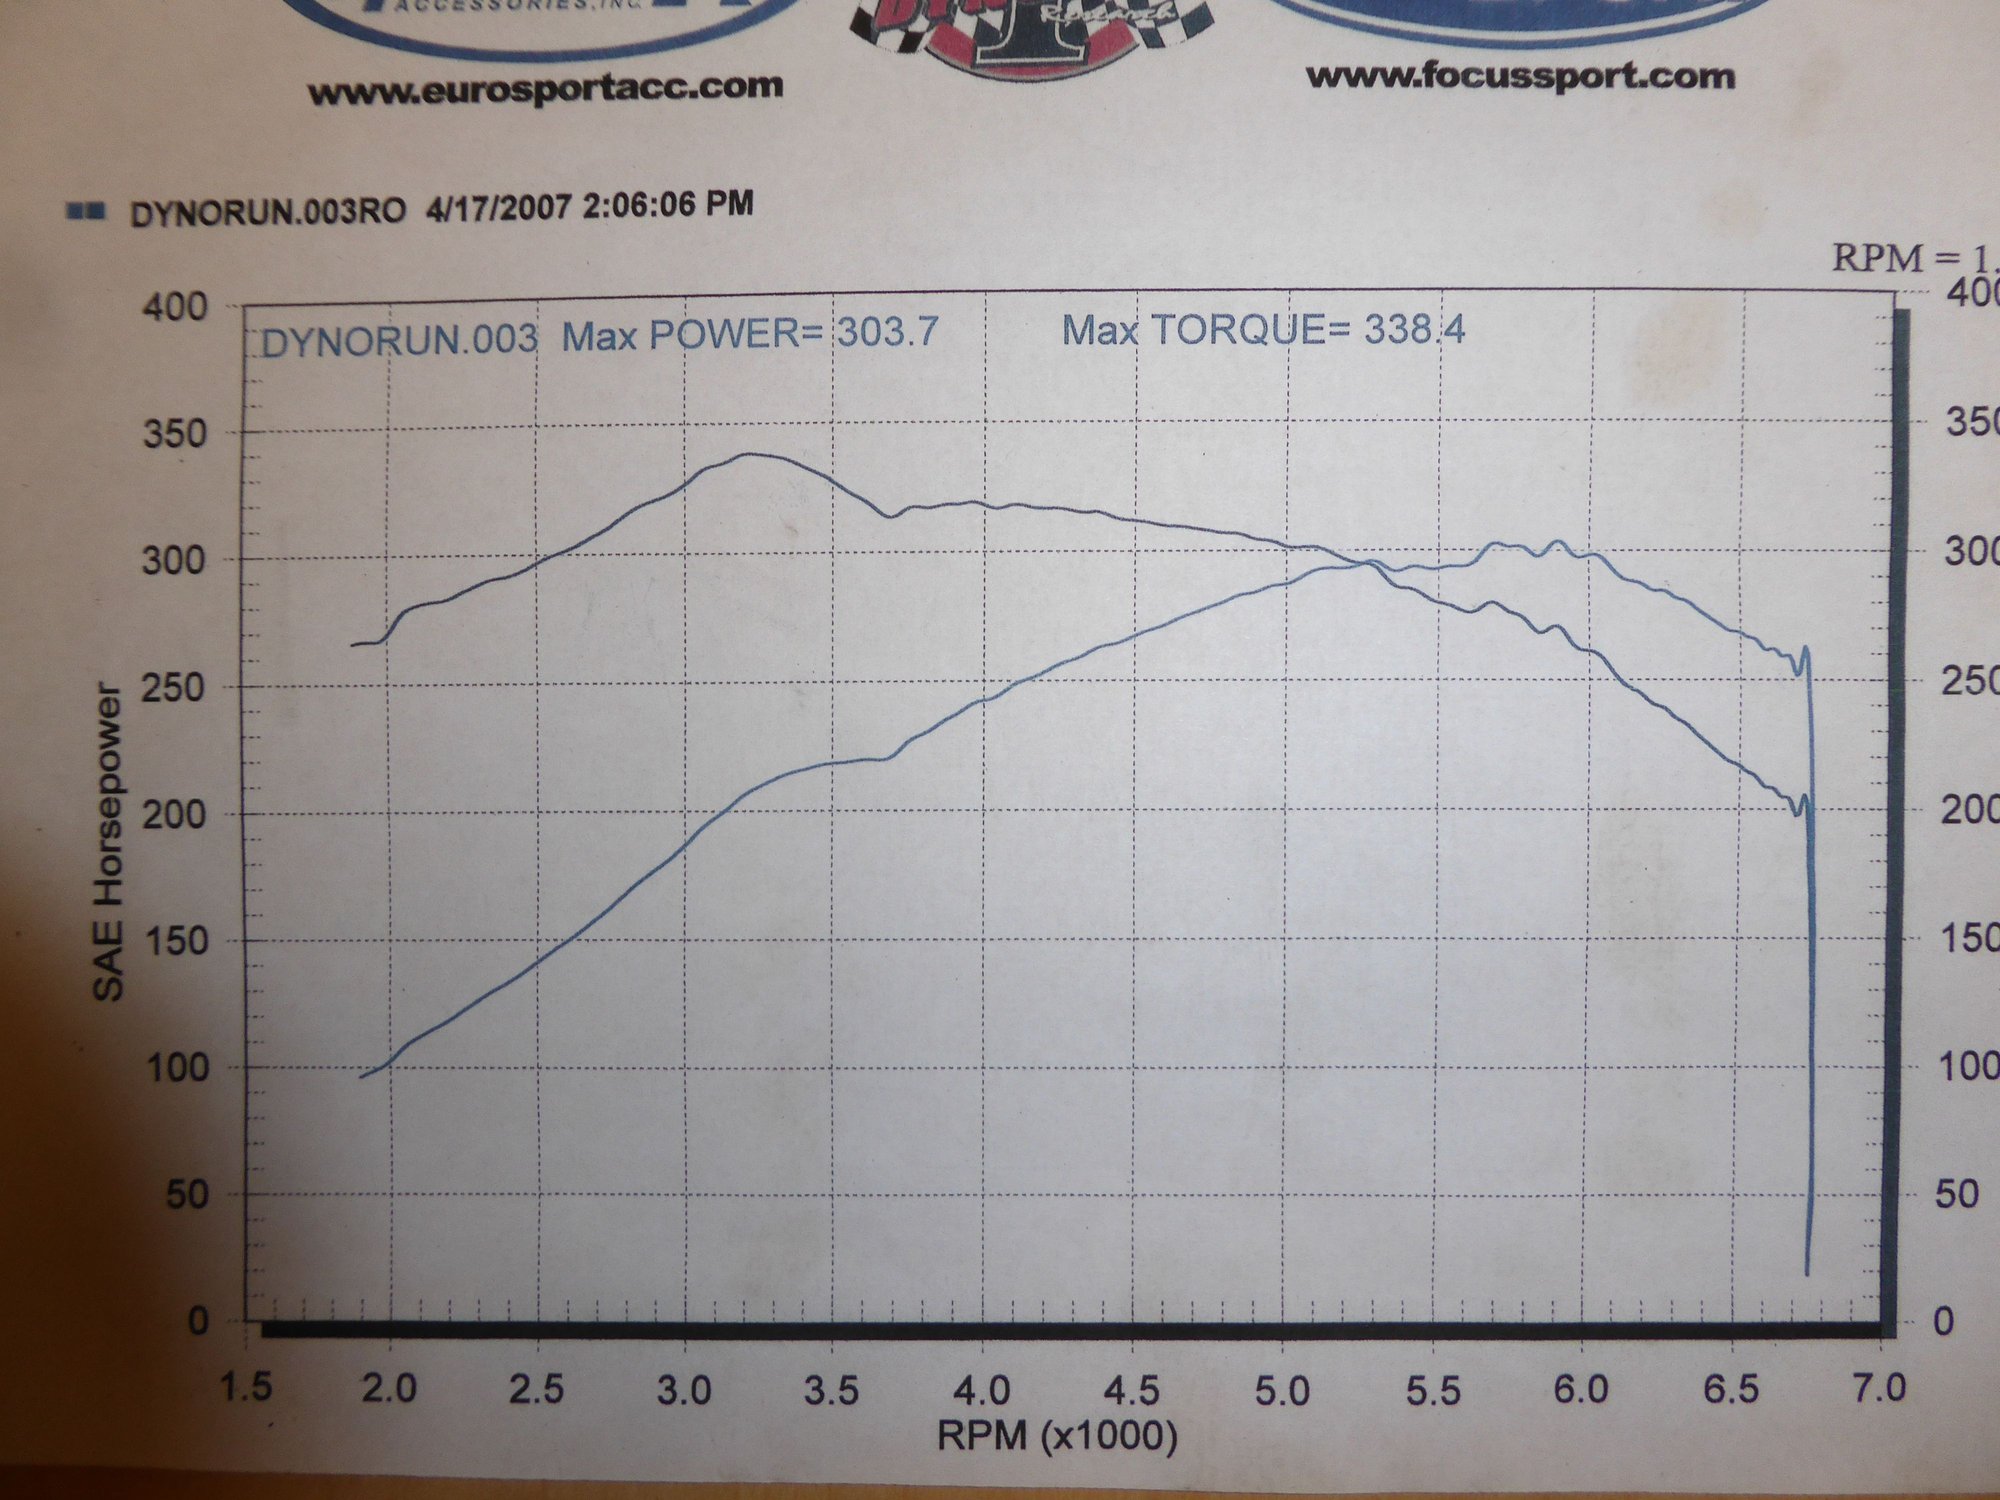
Now, take a look at the following dyno-runs - can anyone spot what is wrong with it?
At the time when this was posted, I got banned for pointing out the error/trickery by the worst-ever moderator in the history of the Internet. I even mathematically rolled-back the result to what it actually tested at.
Clearly, the run above was doctored, just like your 2nd GTS graph was.
Can anyone spot what is wrong with the graph I posted?
Last edited by SwayBar; 08-27-2020 at 10:27 AM.
Reason: Typo...
torque and HP curves should cross at 5252 rpm (due to the formula HP = (Torque x RPM) / 5252 ....hp and torque are equal at 5252)
Edit..weird to see the curves on separate graphs.. will look deeper ...
observations....looks like it was shifted both up and to the right (torque curve of the red run shows flappy actuating at 5400rpm...it should be at 3400ish)
Greg, this is super-easy - what is the correction factor on the second run?
...BOOM!
Additionally, do you really think anyone is going to take that run seriously?
Everyone knows a GTS modded like that will run 335-ish rwhp.
Now, take a look at the following dyno-runs - can anyone spot what is wrong with it?
At the time when this was posted, I got banned for pointing out the error/trickery by the worst-ever moderator in the history of the Internet. I even mathematically rolled-back the result to what it actually tested at.
Clearly, the run above was doctored, just like your 2nd GTS graph was.
Can anyone spot what is wrong with the graph I posted?
It certainly wasn't "doctored".
That's the graph their computer spit out.
They claimed that the correction factor was always the same, on their dyno.
Something was clearly wrong.
It certainly wasn't "doctored".
That's the graph their computer spit out.
They claimed that the correction factor was always the same, on their dyno.
Something was clearly wrong.
Your two graphs are hilarious....
Youre right..I didnt catch the context of the "this is fu*ked up" point earlier Greg.
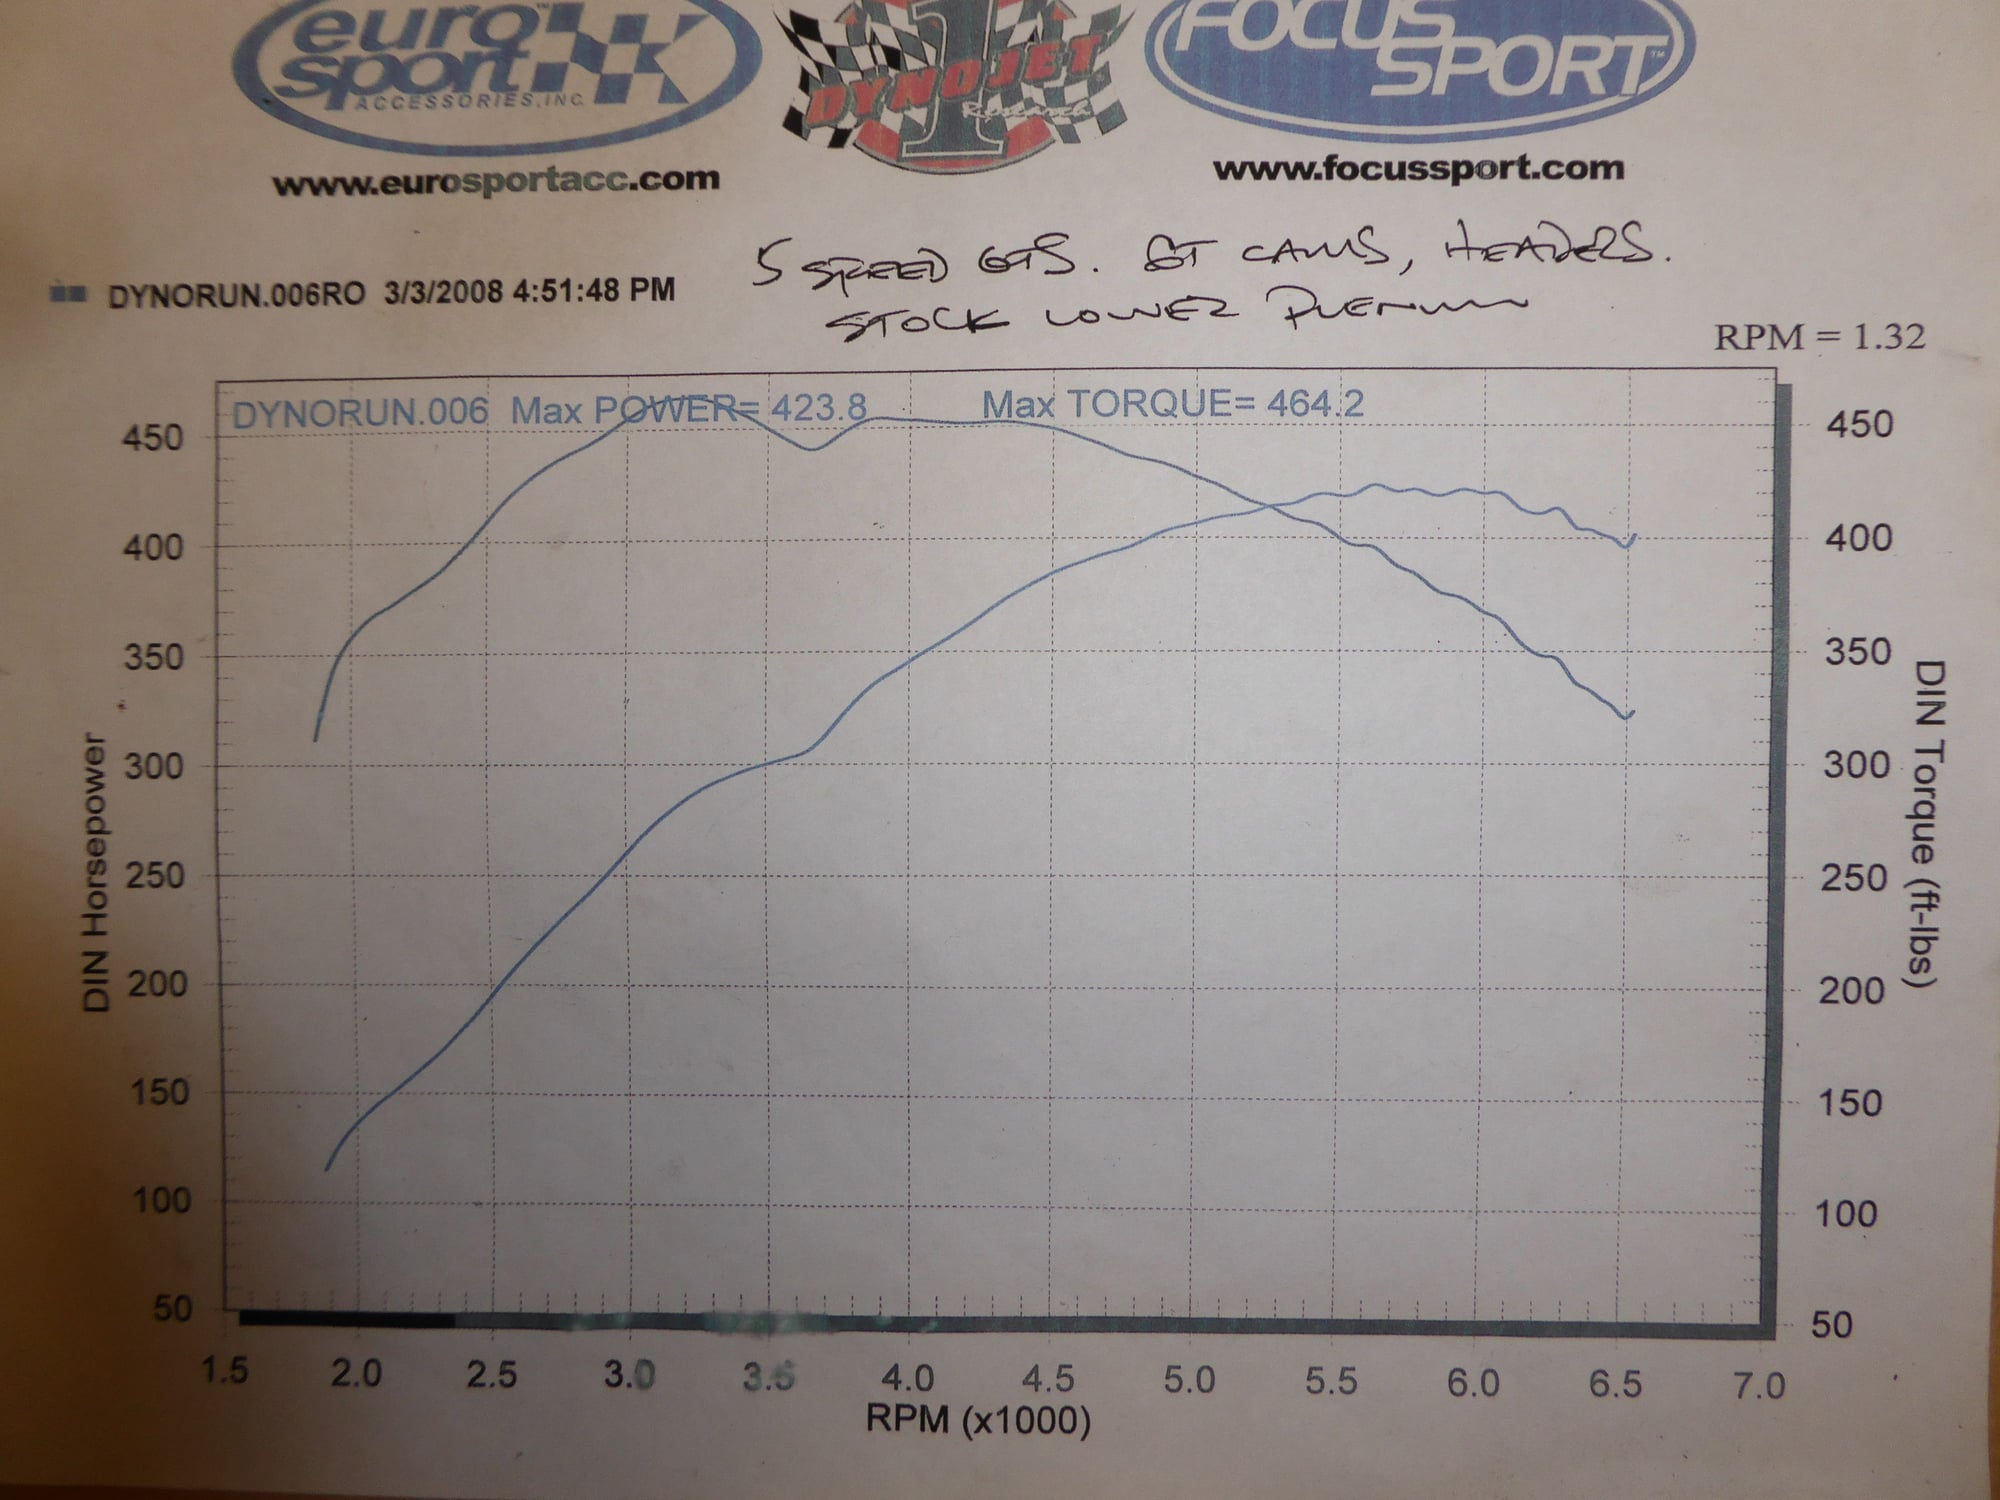
Both DIN and SAE are supposed to represent flywheel HP (eg. engine dyno stand) without accessories I believe. Their conversions from the dynojet rwhp curve generated must have been very optimistic. Probably used an AT conversion factor of 20% loss (for a manual transmission car).
Greg, this is super-easy - what is the correction factor on the second run?
...BOOM!
Additionally, do you really think anyone is going to take that run seriously?
Everyone knows a GTS modded like that will run 335-ish rwhp.
Now, take a look at the following dyno-runs - can anyone spot what is wrong with it?
At the time when this was posted, I got banned for pointing out the error/trickery by the worst-ever moderator in the history of the Internet. I even mathematically rolled-back the result to what it actually tested at.
Clearly, the run above was doctored, just like your 2nd GTS graph was.
Can anyone spot what is wrong with the graph I posted?
Nothing wrong with those curves per se. There are 2 different runs, red and blue. Both the torque & HP numbers appear the same at 5252 RPM for the red set and for the blue set. Red engine not making much torque below 3500 is another story...
Let me be clear. i was speaking ACTUAL Dyno values. these are values that are "UNCORRECTED". i dont think i could have been more clear. if the car accelerates the drum and detects this obvious change in Kinetic energy, then the HP is easy to calculate and there is error ONLY in the accuracy of the dynos ability to detect change of velocity, which should NEVER be in question. the adjustments are as common as someone with a calculator hearing a rumor that with an "automatic" there is a 20% loss and they do a calculation and determine " flywheel hp". see how silly this is?
Im done. You just wanna gaslight people and make **** up.
I was VERY clear. "measurable HP" change to "our cars". sorry, you gave a poor example. its not "gas lighting" its physics. sorry, there is NO wheel and tire change that you would normally make on a 928 that will be measurable on a 248e dyno for the reasons i stated. the entire wheel and tire for the rear tires is equivalent to about 10hp. THIS IS THE ENTIRE WHEEL /TIRE COMBO. now, if that is around 50lbs each (100lbs for the pair) please tell me how you are going to detect a 3% change in diameter, or a 5lb change in weight? Ill wait. let me help..... you cant. (now we are talking to the 4th gear dyno run, which is what is normally done with 99% of all tests, which lasts between 5-7 seconds)
Different acceleration ramp. Your final gear ratio is at the axle. You tire diameter is a lever that slows down the drum acceleration but allows more too end speed.
A load Dyno won't see it as much. But when all you're doing is counting the time between drum revolutions, a larger tire will accelerate it slower. Which over more time reads less energy applied to the drum.
The trade off is a lot more drum speed.
This is wrong. thats like saying using a lower gear will result in higher HP values, and that is patently false. actually, when you do HP measurements in a lower gear , the HP values will be less due to gear reduction losses ,
you try and describe how an inertial dyno works and you get that wrong too. they work by measuring the rate of change of Kinetic energy. the rate of change of KE is not dependent on gear ratios. but because there is a driven load with rotational inertia, it needs to be calculated based on its rate of change of KE, . again, if you have 100lbs of tires/wheel, it will have a greater effect in the lower gears and thats not in question.. we are asking if there is a measurable difference for OUR cars with tire diameters on a dynojet 248e, where the test is dont in 4th gear and the acceleration test takes around 5-7 seconds. you cant accurately measure KNOWN, sub 1hp changes. if you want to know the effect of the driven inertial load based on mass and size over a given time period, we can do this.. its absolute if you have an accurate acceleration profile, and mass distribution /dimensional sizing.
so, tell me how posting an SAE adjusted can be compared to a DIN adjusted measurement, when the topic posted here regarding the dynojet 248e, and its undeniable accuracy to measure HP. yes, there are conversion factors corrected , uncorrected, SAE, etc
when you try and determine HP losses due to the drive train, one major factor is to do coast down tests.... when done, you see that the losses are not linear and are RPM dependent. sure , the "average " is often used, but thats an average. its greater , sometimes 2x at the higher rpm than lower RPM and road speed.
Originally Posted by GregBBRD
Here's two dyno charts...unmodified straight off of the same exact Dynojet....about a year apart: Completely stock 1994 GTS 5 speed in good tune.
1994 GTS 5 speed with Headers, Exhaust and GT Cams.
So the first dyno chart seems pretty reasonable...perhaps a bit on the high side...but it's a Dynojet. And we all know, from reading most of the opinions on this Forum, that Dynojet results are always true.
Anyone want to believe the second Dyno graph? That's a minimum of a 100hp flywheel gain, from some pretty simple changes. (From another point of view, it's a GT with 400 more cc's and headers.)
But, but, but...it's from a Dynojet. It has to be correct!
Bullsh!t.
I have more of these absurd dyno results:
However, I rest my case.
Boom.
A dyno is a tuning tool, track times measure performance.
not really..... so many other factors to consider. Dynos measure a cars ability to accelerate at any speed. they are extremely accurate. (the dynojet 248e) It's up to the builder and driver to take advantage of it. quick example.... we had the slowest day at laguna ive ever seen in 20 years in dry conditions and good temps Most everyone was off by near 3 seconds a lap. it was like we lost 70HP. (as far as measurable "performance")
Last edited by mark kibort; 08-31-2020 at 04:09 AM.
not really..... so many other factors to consider. Dynos measure a cars ability to accelerate at any speed. they are extremely accurate. (the dynojet 248e) It's up to the builder and driver to take advantage of it. quick example.... we had the slowest day at laguna ive ever seen in 20 years in dry conditions and good temps Most everyone was off by near 3 seconds a lap. it was like we lost 70HP. (as far as measurable "performance")
Was the air quality very poor from the fires? IF it was really bad, it could explain a drop but 3 seconds is a huge loss
The drag strip quarter mile trap speed MPH seems to correlate well with the average dyno power between the shift points holding the vehicle weight constant.
The ET can be all over the place depending on the suspension, tires, track condition, driver skill, etc. so it's not a good measure of engine power. I assume that same is even more true about lap times on a road course, so many other factors.


 08-27-2020, 10:11 AM