
9M Prototype intercooler test report


Thread Starter
Addict
Rennlist Member
Rennlist Member

Joined: May 2001
Posts: 4,457
Likes: 123
From: UK
Addict
Lifetime Rennlist
Member
Lifetime Rennlist
Member
Joined: Apr 2002
Posts: 5,456
Likes: 185
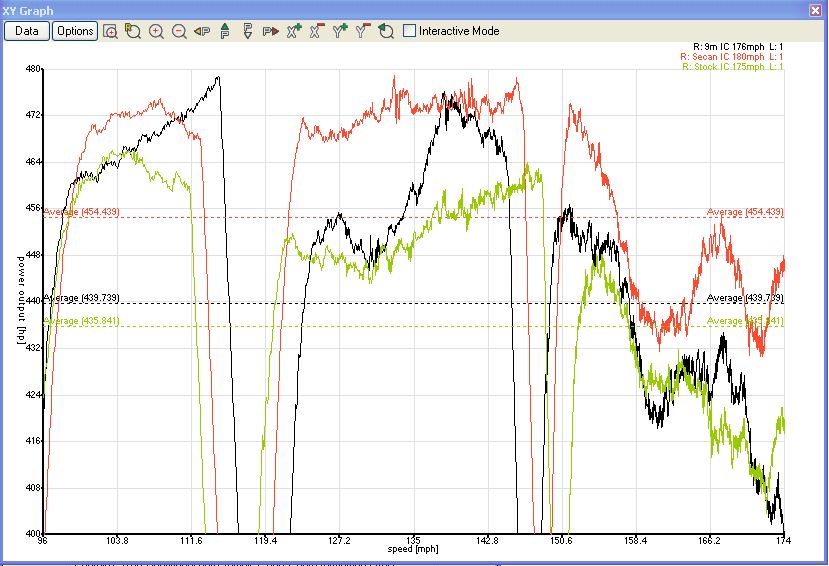
If I can give this a try, I have extrapolated HP figures through the Ax22 tool for the three runs. One with the stock cooler, the second with Secan and the third with the 9M intercooler.
The three runs use exactly the same parameters, so they are comparable. Always be careful when comparing isolated peaks as parasitic losses might be at play.
It very clearly shows the HP loss that you see between each intercooler. Absolute numbers are not necessarily exact, but the percentage variances should be. Notice how the runs have different HP patterns, the 9M IC seems to pick up steam with RPMs (Maybe Phelix can check against boost levels at those speeds to see if boost is spiking with the 9M IC) , whereas the Secan shows a more flat/fat line and holds higher peaks for longer.
The average HP calculated throughout the run below (96-174mph) with 2 shifts for all runs is as follows:
Secan: 454HP
9M: 440HP
Stock: 436HP
This calculates every point (0.01s) of data and creates an average so it includes shifting time (which drops the average).
Last edited by Jean; May 5, 2008 at 02:31 PM.
Nordschleife Master
Joined: Dec 2001
Posts: 8,305
Likes: 16
From: Kingston, NY
Jean, is that calculation based only on the air density from the different temps? Or does it also take into consideration the ignition timing differences due to air temp. It would have been interesting if the ignition timing was also logged during the runs.
Addict
Lifetime Rennlist
Member
Lifetime Rennlist
Member
Joined: Apr 2002
Posts: 5,456
Likes: 185
Geoffrey
No, this calculation is based strictly on motion dynamics formulas, RPM, torque/thrust/long Gs/gearbox ratios/tire OD/aerodynamic drag and rolling resistance. Since we are using the same car and parameters, the relative rather than absolute variance is the most meaningful KPI. I think Phelix just datalogged Boost and IAT at this stage.
No, this calculation is based strictly on motion dynamics formulas, RPM, torque/thrust/long Gs/gearbox ratios/tire OD/aerodynamic drag and rolling resistance. Since we are using the same car and parameters, the relative rather than absolute variance is the most meaningful KPI. I think Phelix just datalogged Boost and IAT at this stage.
Boost Junkie
Lifetime Rennlist
Member
Lifetime Rennlist
Member
Joined: Jan 2004
Posts: 2,575
Likes: 64
From: Plymouth MN/Scottsdale AZ
Good stuff - thank you gents. Toby, early in your post you mention the Secan as being $30k and later as $16k. Is the difference the price you paid vs the current price?
Thread Starter
Addict
Rennlist Member
Rennlist Member
Joined: May 2001
Posts: 4,457
Likes: 123
From: UK
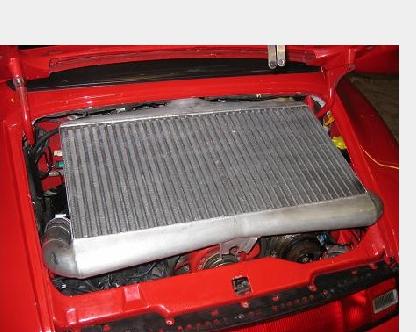
The $16K one is the one which MOD and I have and this was commisioned by RS Tuning in 2006. The cores on the 2006 version are even more efficient than the $30K one the 2006 one is a lot smaller but fatter. RS say that the $30K one would keep intake temps within 20DegC of ambient and the new one within 25DegC of ambient...

Addict
Rennlist Lifetime Member
Rennlist Lifetime Member
Joined: Nov 2003
Posts: 1,789
Likes: 43
From: UK
That's correct - only IAT and boost at this time. I think I can read cylinder head temp and the MAF voltage by tapping into the appropriate wires. Not sure how to read ignition advance - the data is available on the OBD-II port but I believe the latency is too high for it to be terribly meaningful. And the current DL1 firmware from Race Technology does not yet support an incoming OBD datastream.
Jean, your average HP figures are quite high for a UMW stage 2 kit, no?
Here are the updated graphs for stock, 9M and Secan intercoolers respectively.
Jean, your average HP figures are quite high for a UMW stage 2 kit, no?
Here are the updated graphs for stock, 9M and Secan intercoolers respectively.
Addict
Lifetime Rennlist
Member
Lifetime Rennlist
Member
Joined: Apr 2002
Posts: 5,456
Likes: 185
Phelix, Thanks for the data.. Yes you can clearly see how the highest boost point at around 140mph coincides with the highest HP peak on my 9M (black) line at around that same speed.
As far as absolute numbers, they are not relevant as I mentioned above, since I need to use the correct aerodynamic data, rolling resistance and drag and enter it in the tool parameters, but I used the same assumptions for the three runs so the comparison is consistent in relative terms.
I can fix per the correct CDA and weight and repost if you guys prefer (in fact I will do it in a while), this is all being done by the tool, not my own calculations so I do not control many of the parameters.

Thread Starter
Addict
Rennlist Member
Rennlist Member
Joined: May 2001
Posts: 4,457
Likes: 123
From: UK
Jussi
Very impressive and it is what we would expect since at the IAT of the 9M the Motronic is only retarding by 0.5 degree so very similar to the Secan which will be maximum timing - the poor old stock unit will have that 4.5degree retard holding the power back....
On a hotter day the Secan will hold more power than the 9M by the looks of it....
Addict
Rennlist Lifetime Member
Rennlist Lifetime Member
Joined: Nov 2003
Posts: 1,789
Likes: 43
From: UK
Top man Jussi. At first glance this would tend to indicate that the 9M and Secan intercoolers resulted in very similar engine performance despite the Secan acheiving lower IATs. So perhaps on a real hot day the Secan would make a real difference but not at 18 C? But having said that the curves are almost "parallel" in 4th gear and then very much so in 5th and sixth? I was concentrating on Vmax rather than absolute repeatability in the shift points and the braking point.
Addict
Lifetime Rennlist
Member
Lifetime Rennlist
Member
Joined: Apr 2002
Posts: 5,456
Likes: 185
I have adjusted the horsepower graphs to reflect the real data. CDA per stock 993TT, running weight 1600kgs and rolling resistance 0.015. The resulting power graphs are shown above.
The speed vs time data can lead to confusion when one compares vs. to the power curves. The first shift with the stock intercooler was slow in comparison, when one extrapolates the total time in negative Gs, you can see that the stock intercooler had a slow shift, and this is where the other two somewhat "ran away".
I think it is amazing how broad the power curve becomes with the Secan without any custom tuning. The stock intercooler does not seem to be able to cope with the rather highish boost, while the Secan just takes all you can throw at it. My next purchase.
Thread Starter
Addict
Rennlist Member
Rennlist Member
Joined: May 2001
Posts: 4,457
Likes: 123
From: UK
Phelix/Jean
Is it possible to get an "average boost" number in each gear for the three tests ?
The boost reduction by the Motronic is the other control activated at the IAT heat thresholds - it is difficult to see from the wiggley lines but it looks like the Secan and 9M are seeing more boost during the runs -can we quantify that ?