Verus Engineering 300mm Rear Wing, Wind Tunnel Testing
#1
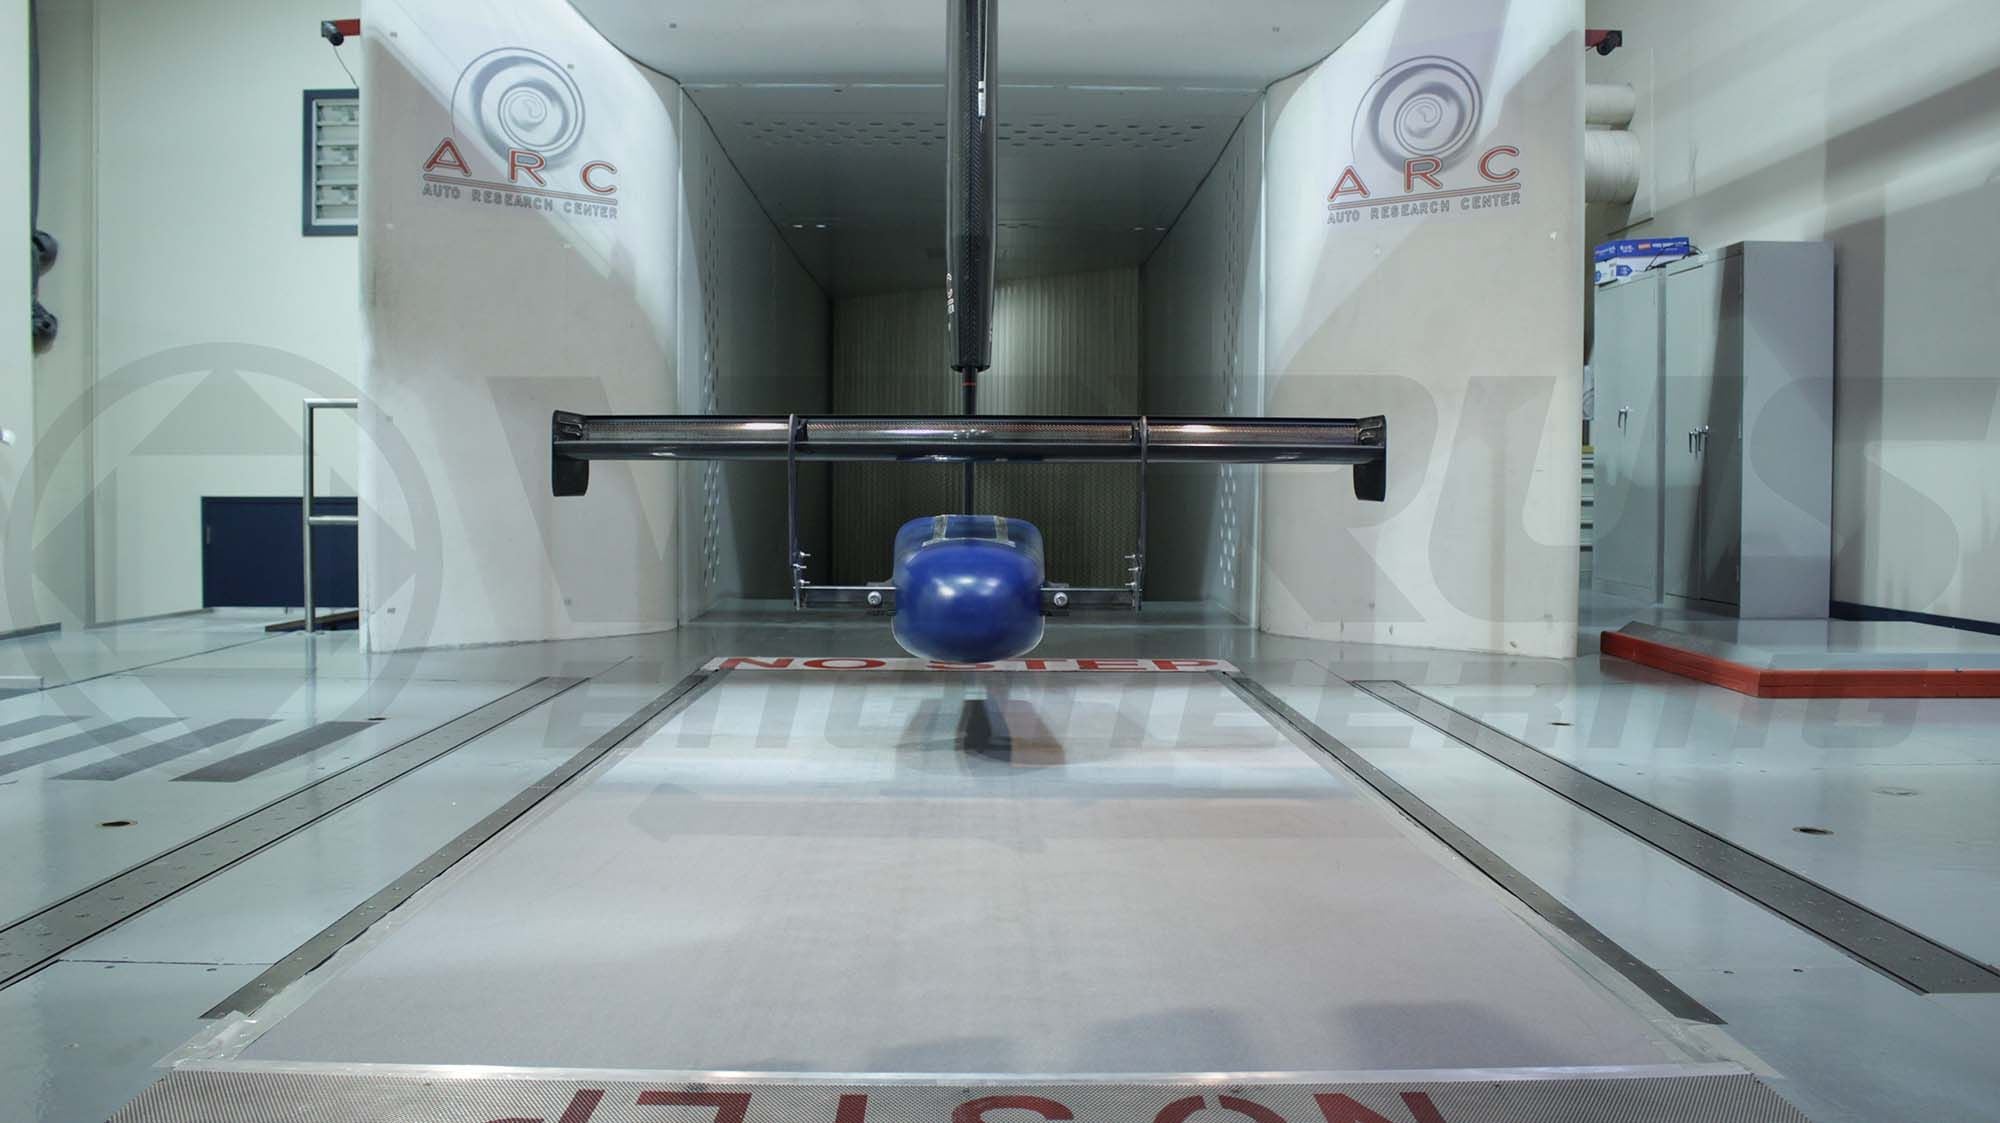
300mm Chord, 1800mm Span, Rear Wing in Tunnel
Verus Wind Tunnel Results
A few months ago, Verus went to the wind tunnel with the goal of validating our CFD analysis. We tested at Auto Research Center Indianapolis (ARC Indy) using their wind tunnel for full-scale wing testing. Two of our rear wings were tested, along with 4 other wings from various other small businesses/privateers, using fixtures designed and built in house. Before releasing our 987 and 981 GT4 rear wing products; we wanted to share the results and findings from the wind tunnel.
Why Does Validation Matter?
Validating our CFD to wind tunnel data ensures that our test procedures within CFD are accurate and reasonable. CFD can be run incorrectly, easily, and we wanted to make certain that our results within CFD estimate real world numbers.
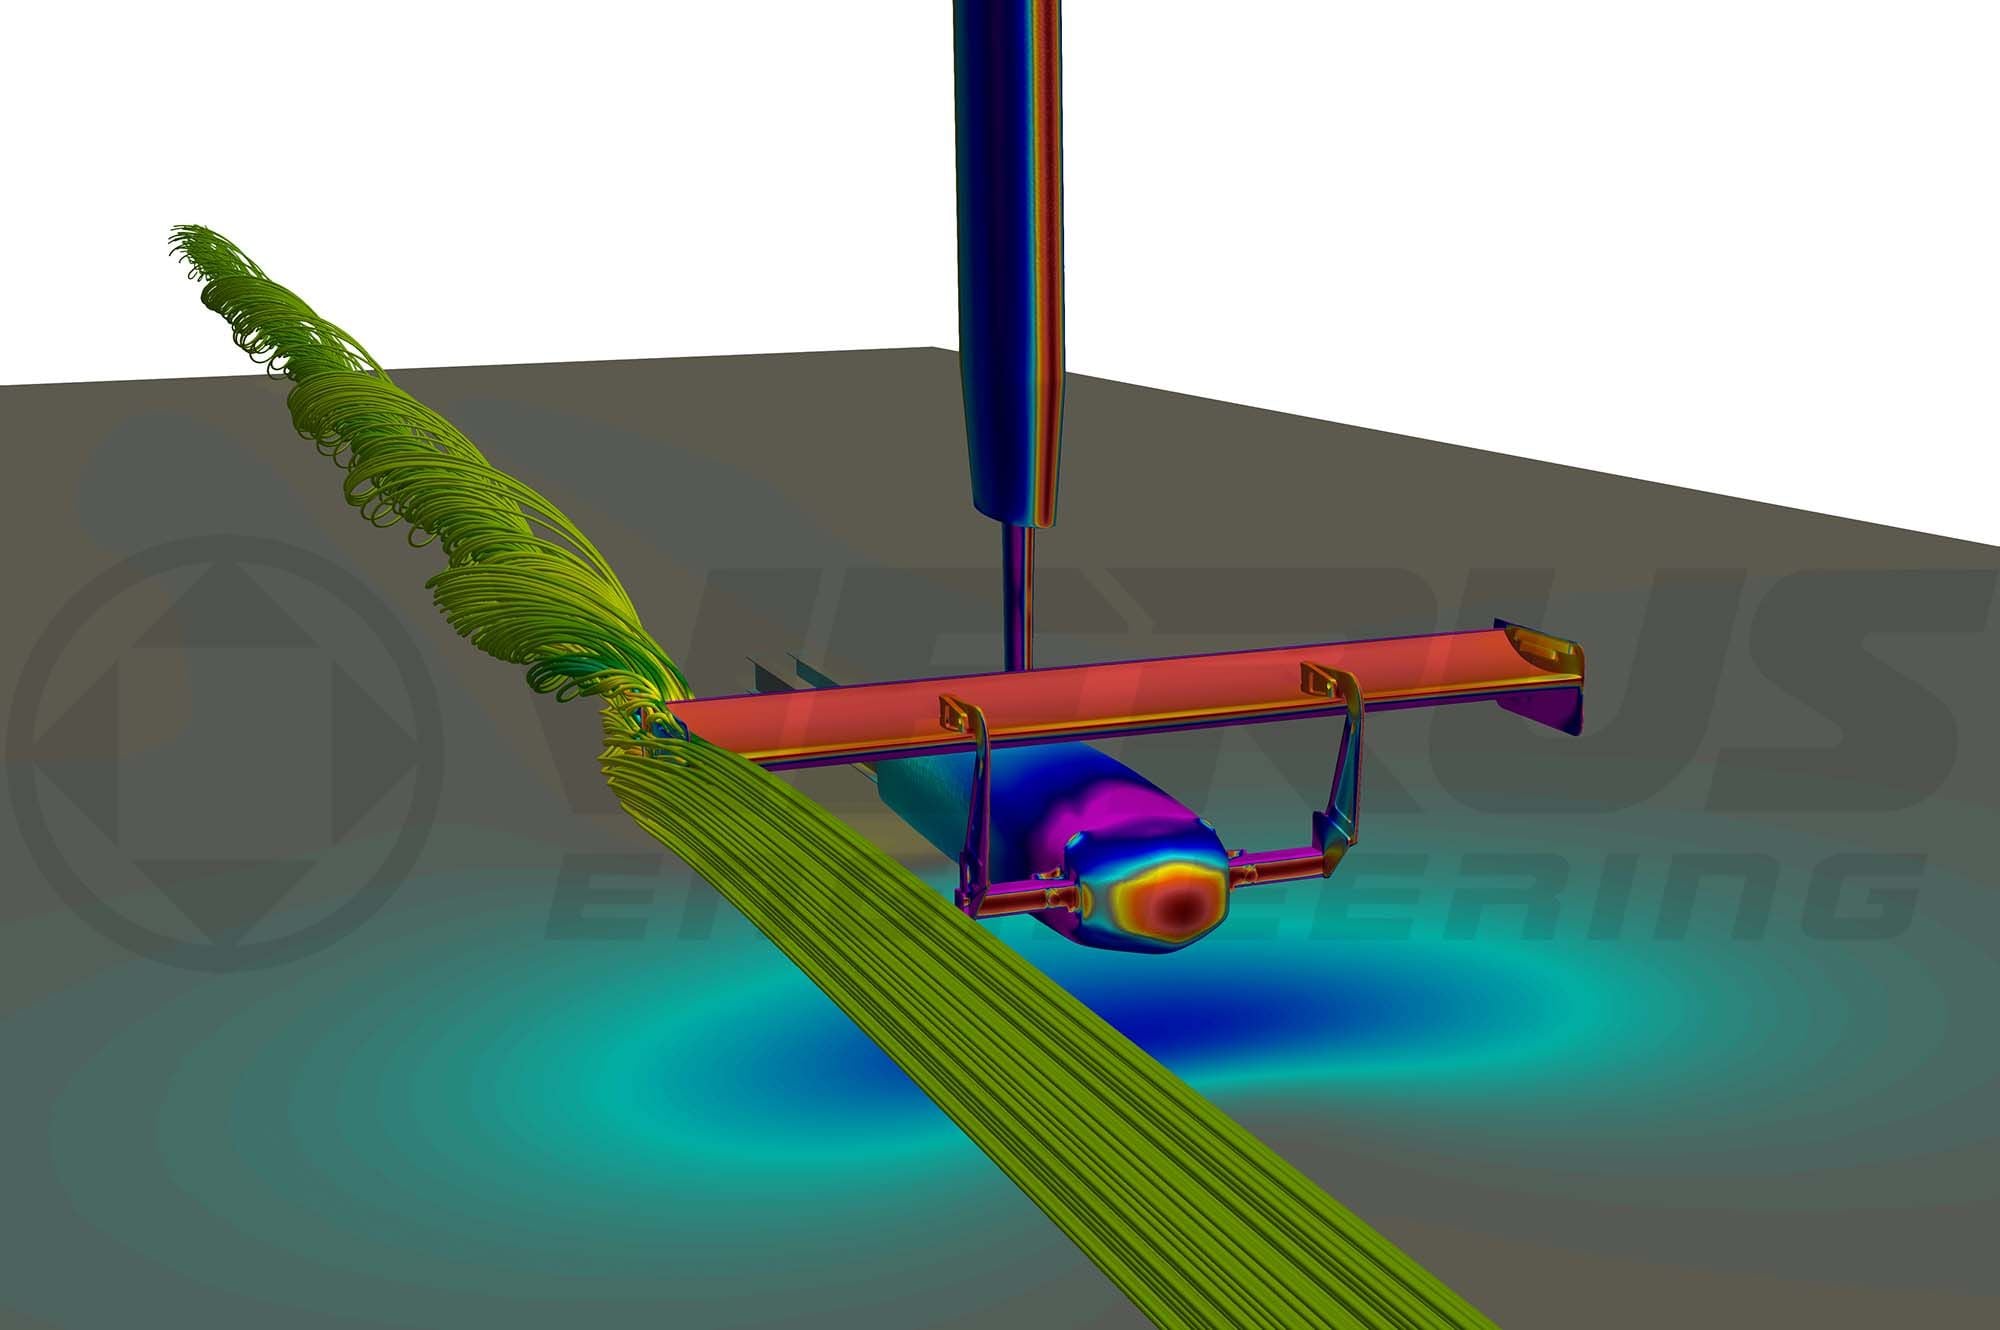
300mm Chord Wing in CFD on ARC Sting
How Did We Run CFD to Compare to the Wind Tunnel
Unfortunately, it is physically impossible to test a rear wing in free-stream, which is how we developed our wing profile. The wing needs a way to be held up in the wind tunnel; so to correlate our results from CFD to the wind tunnel; we had to model and CFD the entire sting at the correct height off the tunnel floor. The wind tunnel tests were run at ~80 MPH or 36.5 meters per second.
Mesh generation, analysis, and post-processing were handled by ANSYS. The mesh for this run was a bit over 40 million cells. The wing had 20 prism layers with a first cell height of 0.005mm to capture the viscous sublayer. We ran the wing through our main (3) turbulence models, K-Omega SST, K-Epsilon Realizable, and Spalart-Allmaras. We primarily use K-Omega SST in our analysis; but, presented a chance to improve our processes, we tested all three.
Verification and Validation - Downforce
The graph below shows downforce for the experimental data (wind tunnel) compared to our CFD with different turbulence models applied. The analysis using the K-omega SST turbulence model was the closest to the wind tunnel results. Comparing this data; our CFD analysis underestimated downforce by 3.4lbs at 80 MPH; 7.5lbs at 120 MPH, and 13.4lbs at 160 MPH.
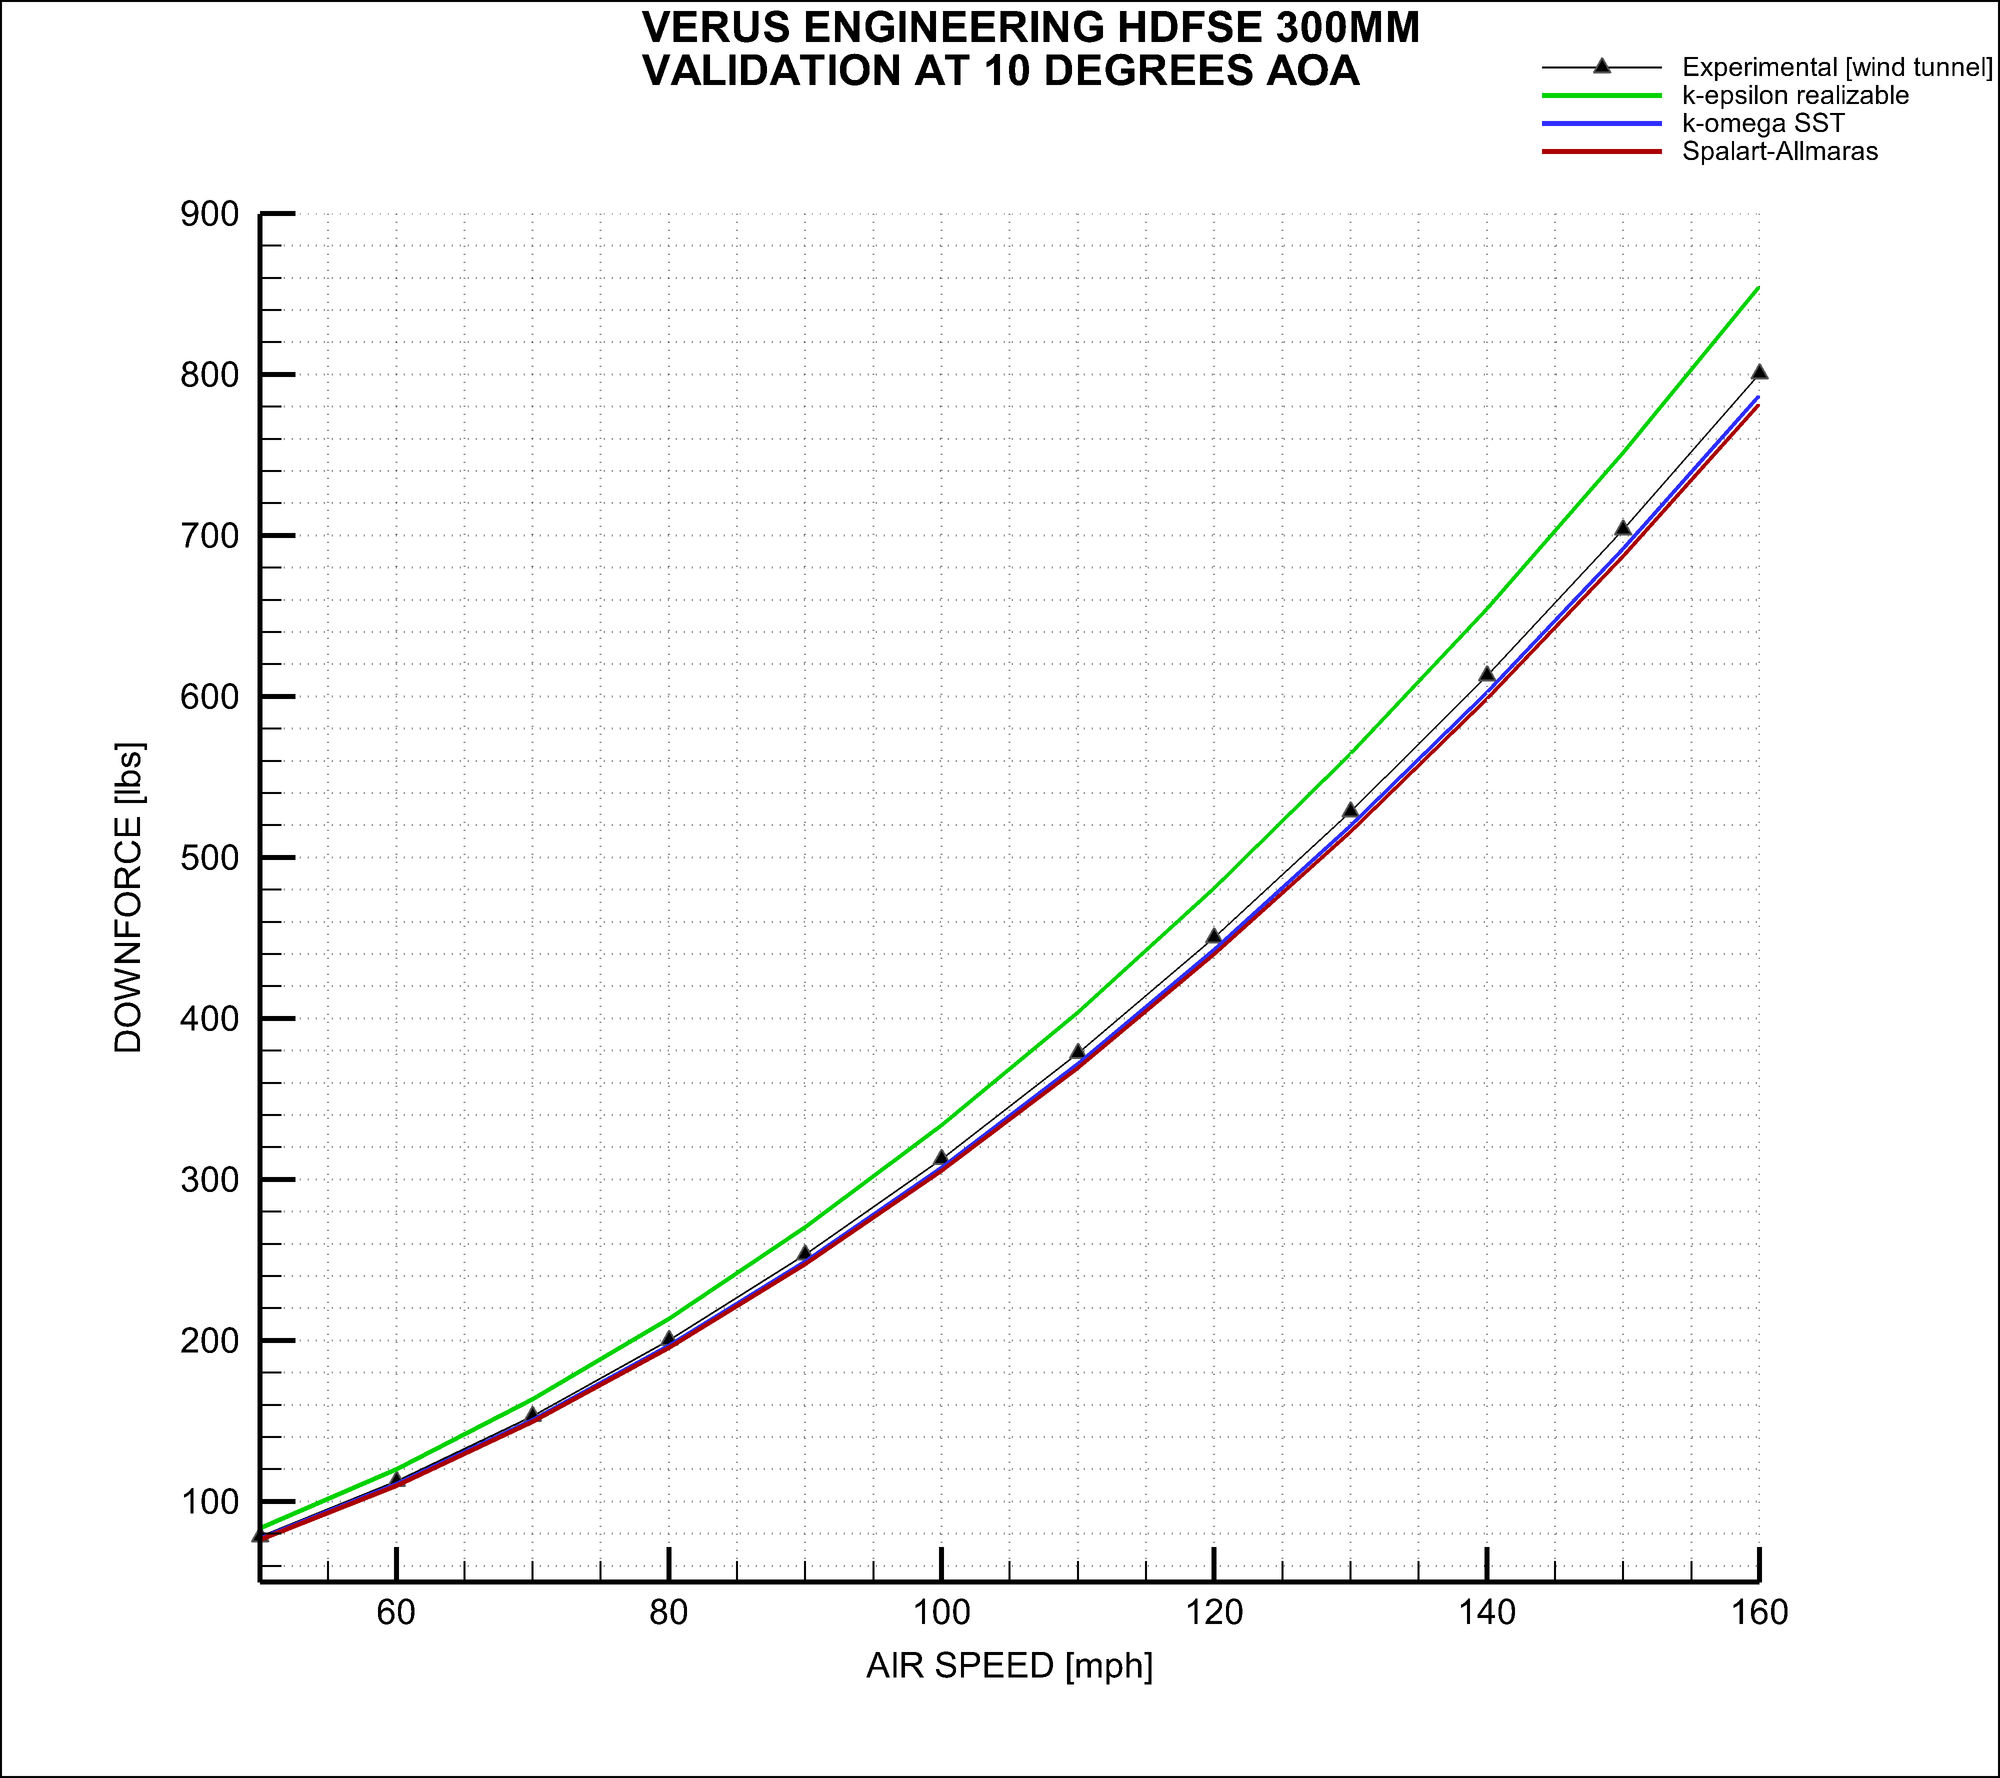
Verus Validation - Downforce
Verification and Validation – Drag
The graph below shows drag for the experimental data (wind tunnel) compared to our CFD with the same turbulence models above. The analysis using the K-Omega SST turbulence model was again the closest to the wind tunnel results. Comparing this data, our CFD analysis underestimated drag by 0.7lbs at 80MPH, 1.6lbs at 120 MPH, and 2.8lbs at 160 MPH.
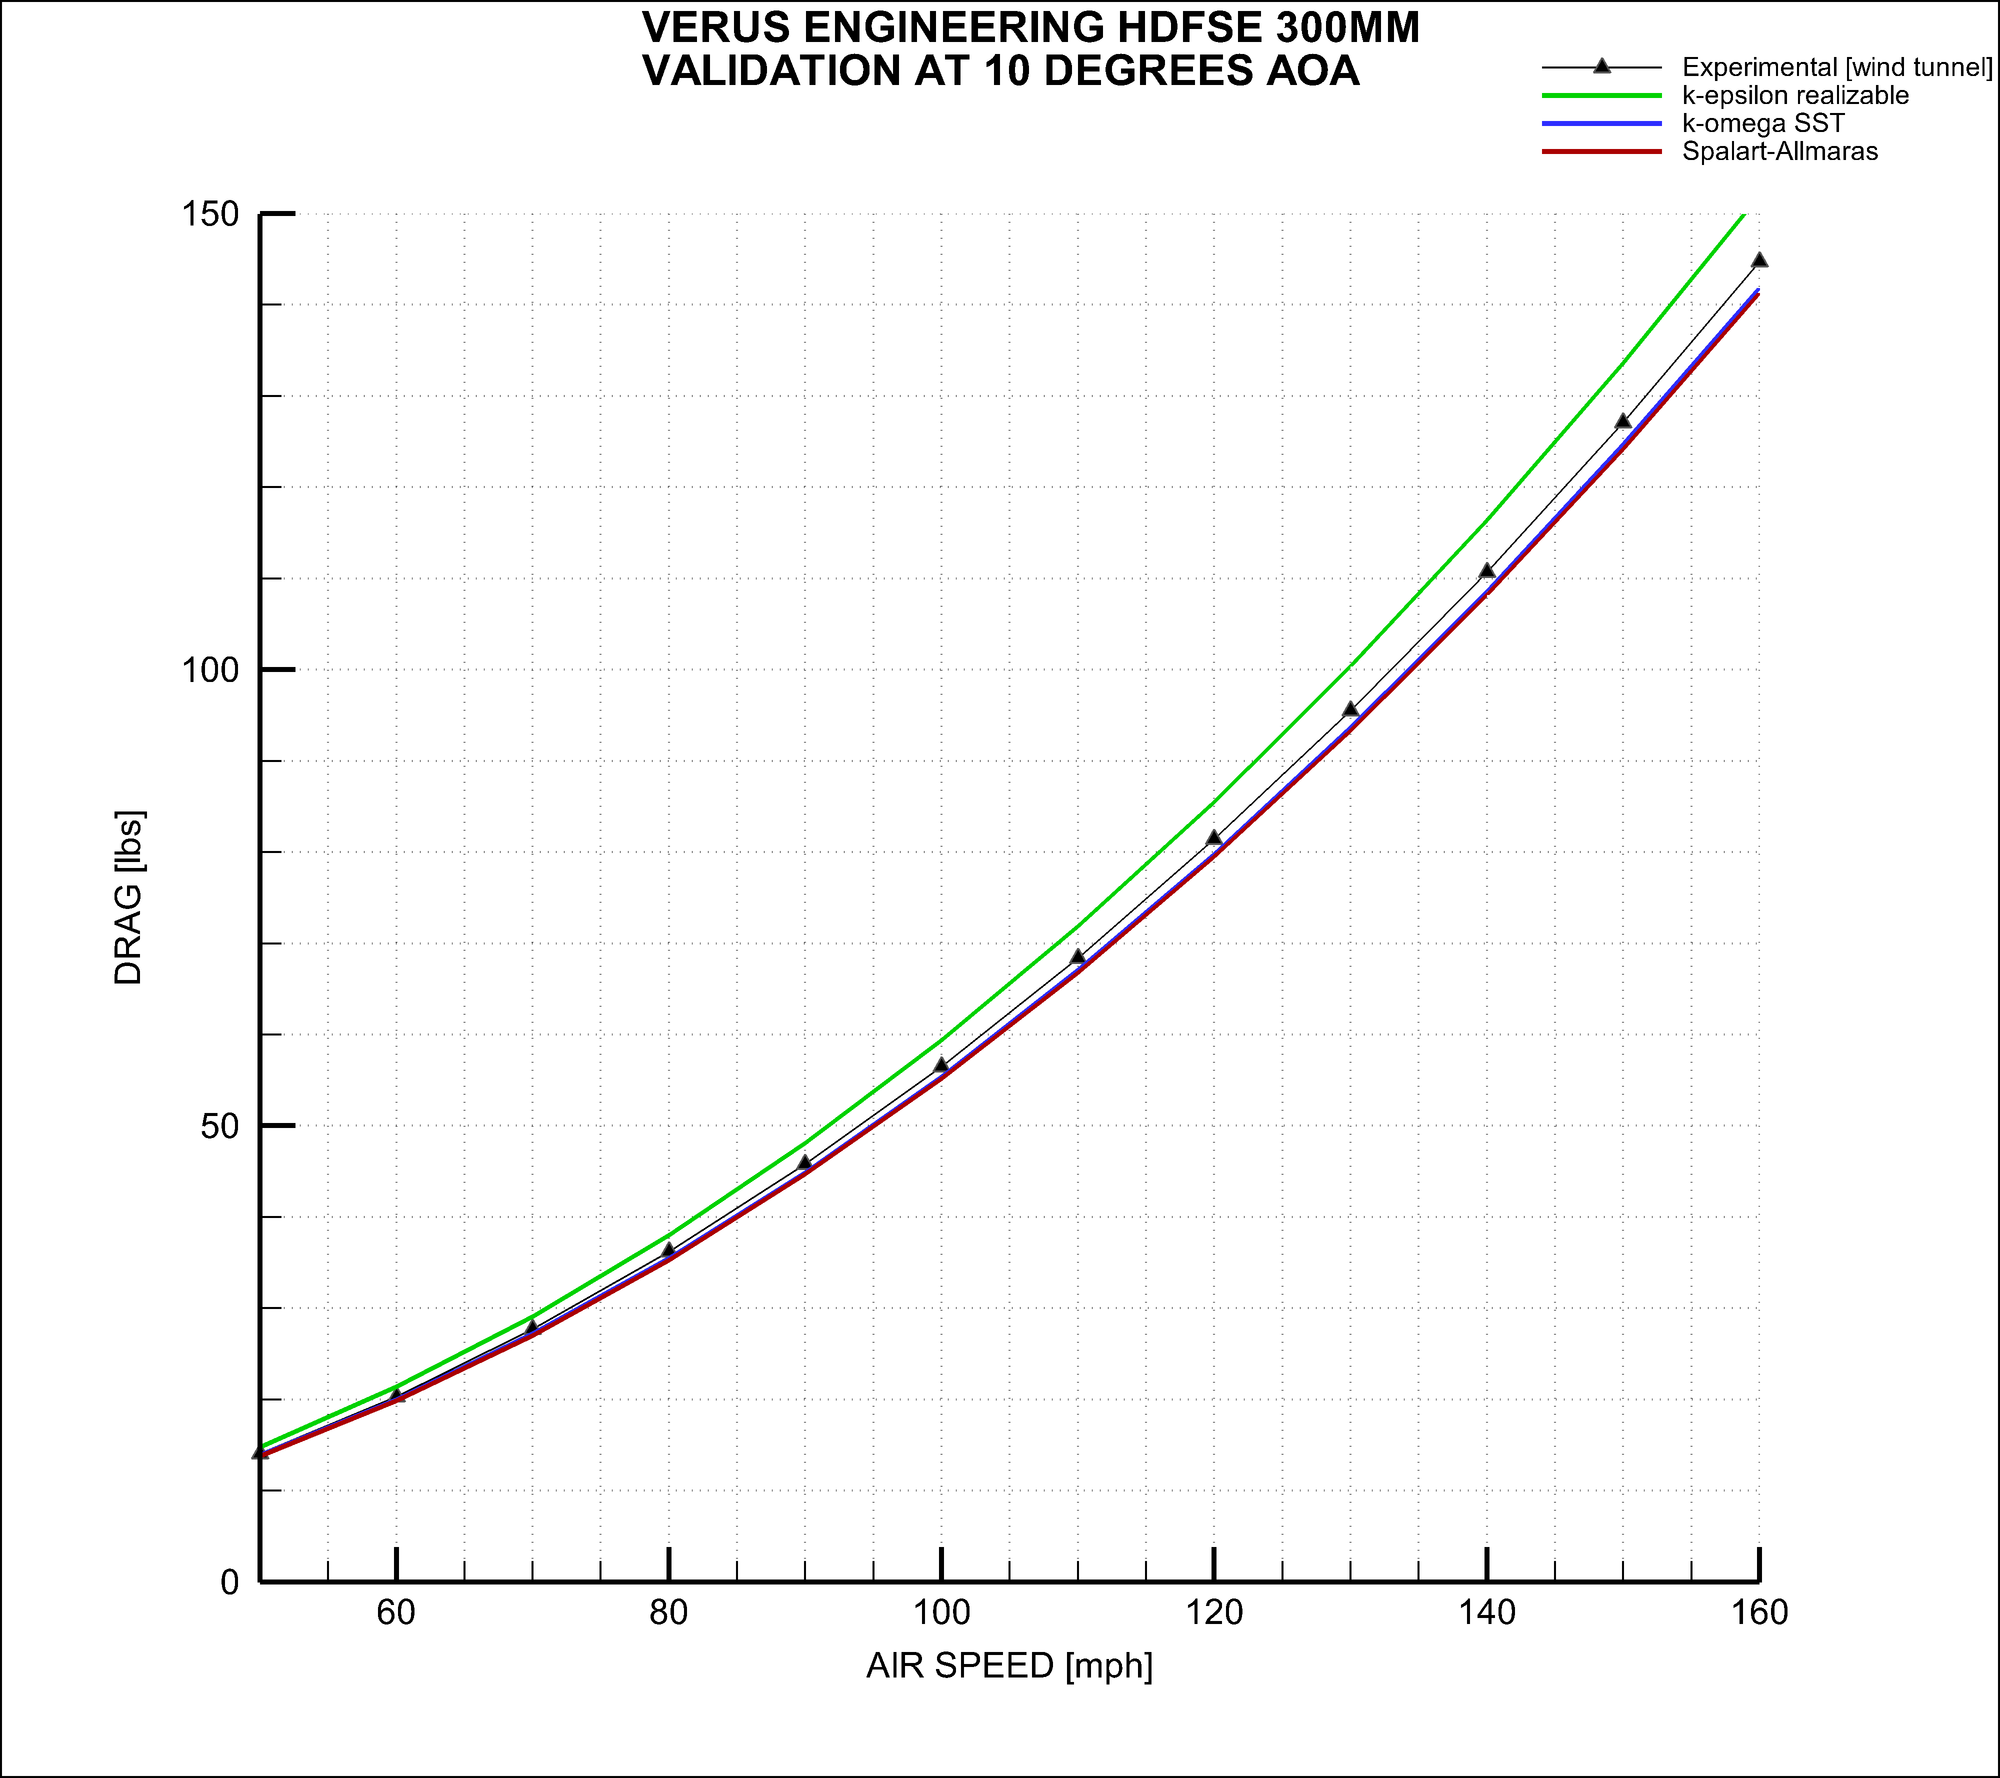
Verus Validation - Drag
Verification and Validation - % Difference

Verus Validation Chart
Conclusion
With under a 2% difference from our CFD analysis to the wind tunnel; we are happy with the results correlating so well. This really helped us solidify our analysis procedure and ensure what we do for each analysis is indeed correct and correlates to real-world results.
Please let us know if you have any questions or comments. We appreciate any and all feedback.
#2
Basic Sponsor
Rennlist
Site Sponsor
Rennlist
Site Sponsor
Interesting write up and presentation. Your write up states the physical test at one wind speed but the graph seems to show it at several speeds for comparison to your various model calculations, can you explain this?
__________________
Dave
Rennkit
djcooper@rennkit.com
http://rennkit.com/
Rennkit
djcooper@rennkit.com
http://rennkit.com/
- Patented eRam Kit™ for 996/997 Turbo & Carrera GT wings
- Cal*Cool™ - brake cooling 996/997 / Bluetooth Retrofit Kit™ for 1998-2011 cars / Wing Extenders™ 987 Cayman / 997 Turbo
- AUTO-BLiP for MT / Function F1RST Shift ***** / Girodisc 2-piece rotors / OS Giken LSD / Phenix suspension / Zunsport grills / 997/987 switches/PCM ***** / Border Coilovers
#3
Note that this is just an extrapolation. Sometimes parts follow this well and sometimes they do not. It depends how sensitive the parts are to the Reynolds Number of the test speeds. Before getting too technical, when we tested the wing in CFD, it did not show this sensitivity at the speeds a vehicle will see. I can go more in depth on this type of explanation if others would like, but not sure if it is wanted/needed. A general rule of thumb is that this type of extrapolation is perfectly valid for most of our aerodynamic work.
#4
Burning Brakes
Did you test the stock GT4 wing, and if so, can you show a graph that compares the two wings. Curious to see what the differences is between yours and the OEM part under the exact same conditions. Thanks in advance if this is possible.
#5
Rennlist Member
As a former wind tunnel test engineer (and still heavily involved with it), nice to see some real data!
Seeing more downforce in that ideal scenario makes sense without the separated air coming off the roof on the actual car, but still very good comparisons. Any plans for repeating the test with a mockup of the car in front of the wing to better characterize its performance?
Also how close are you to the walls?
#6
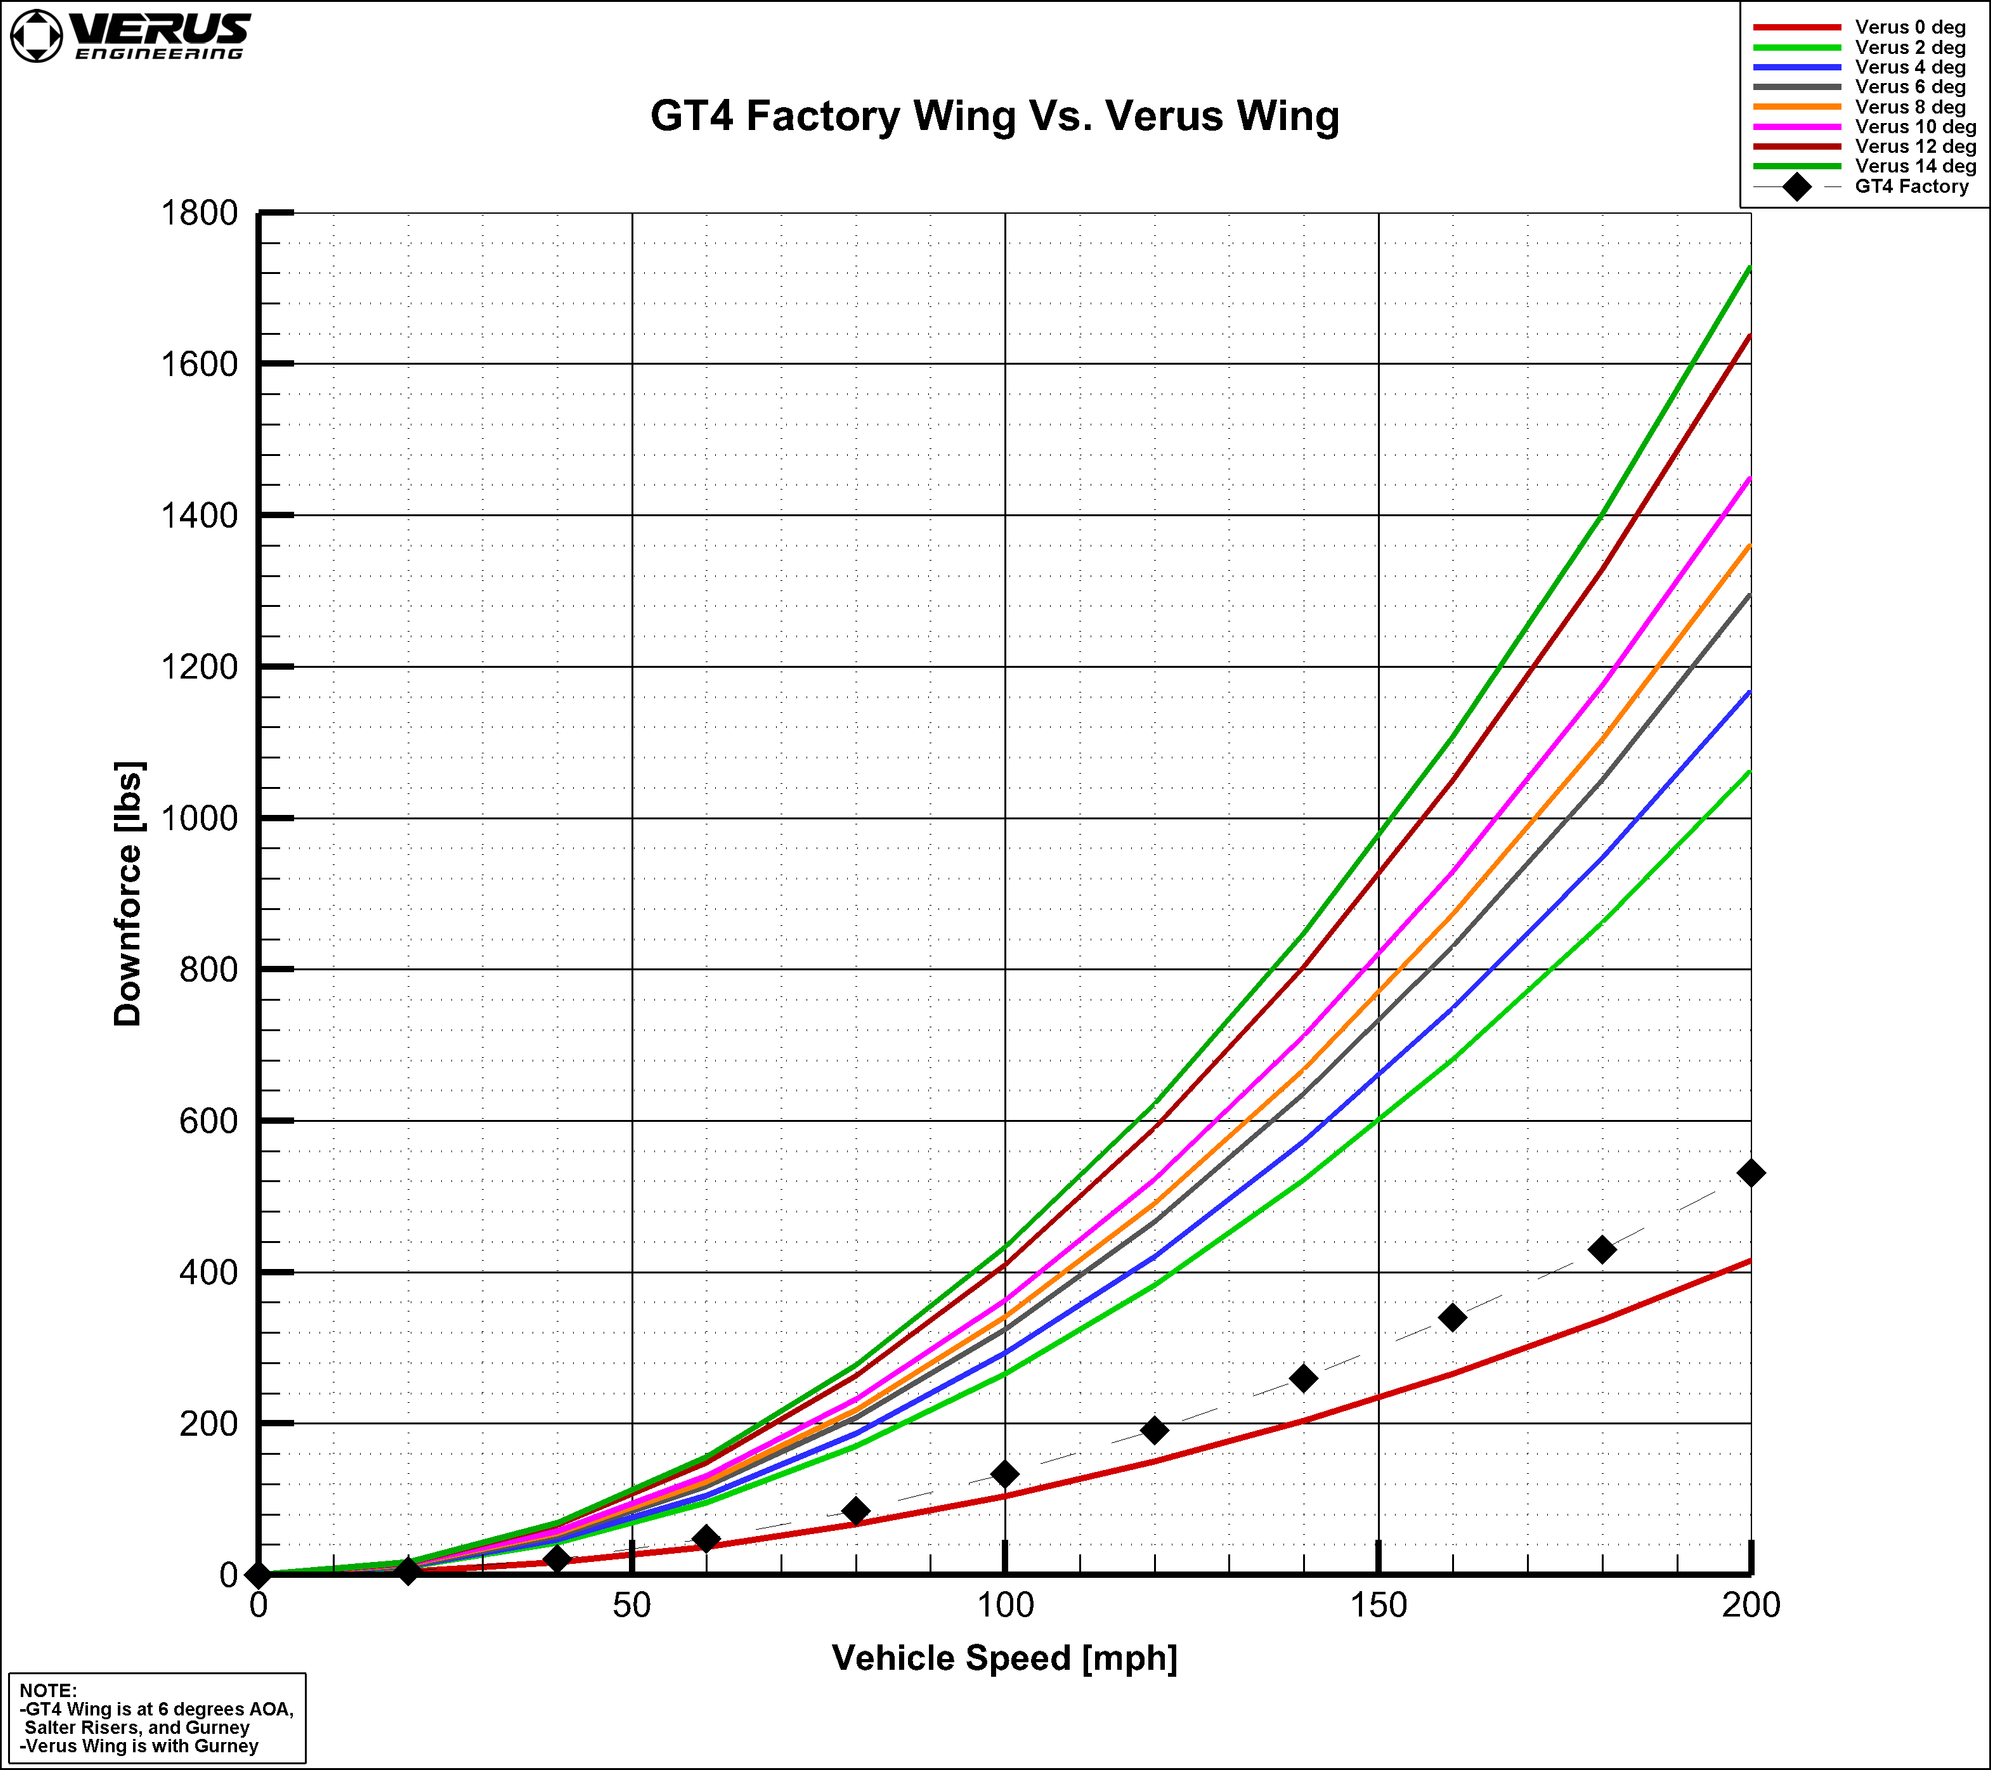
Downforce Graph
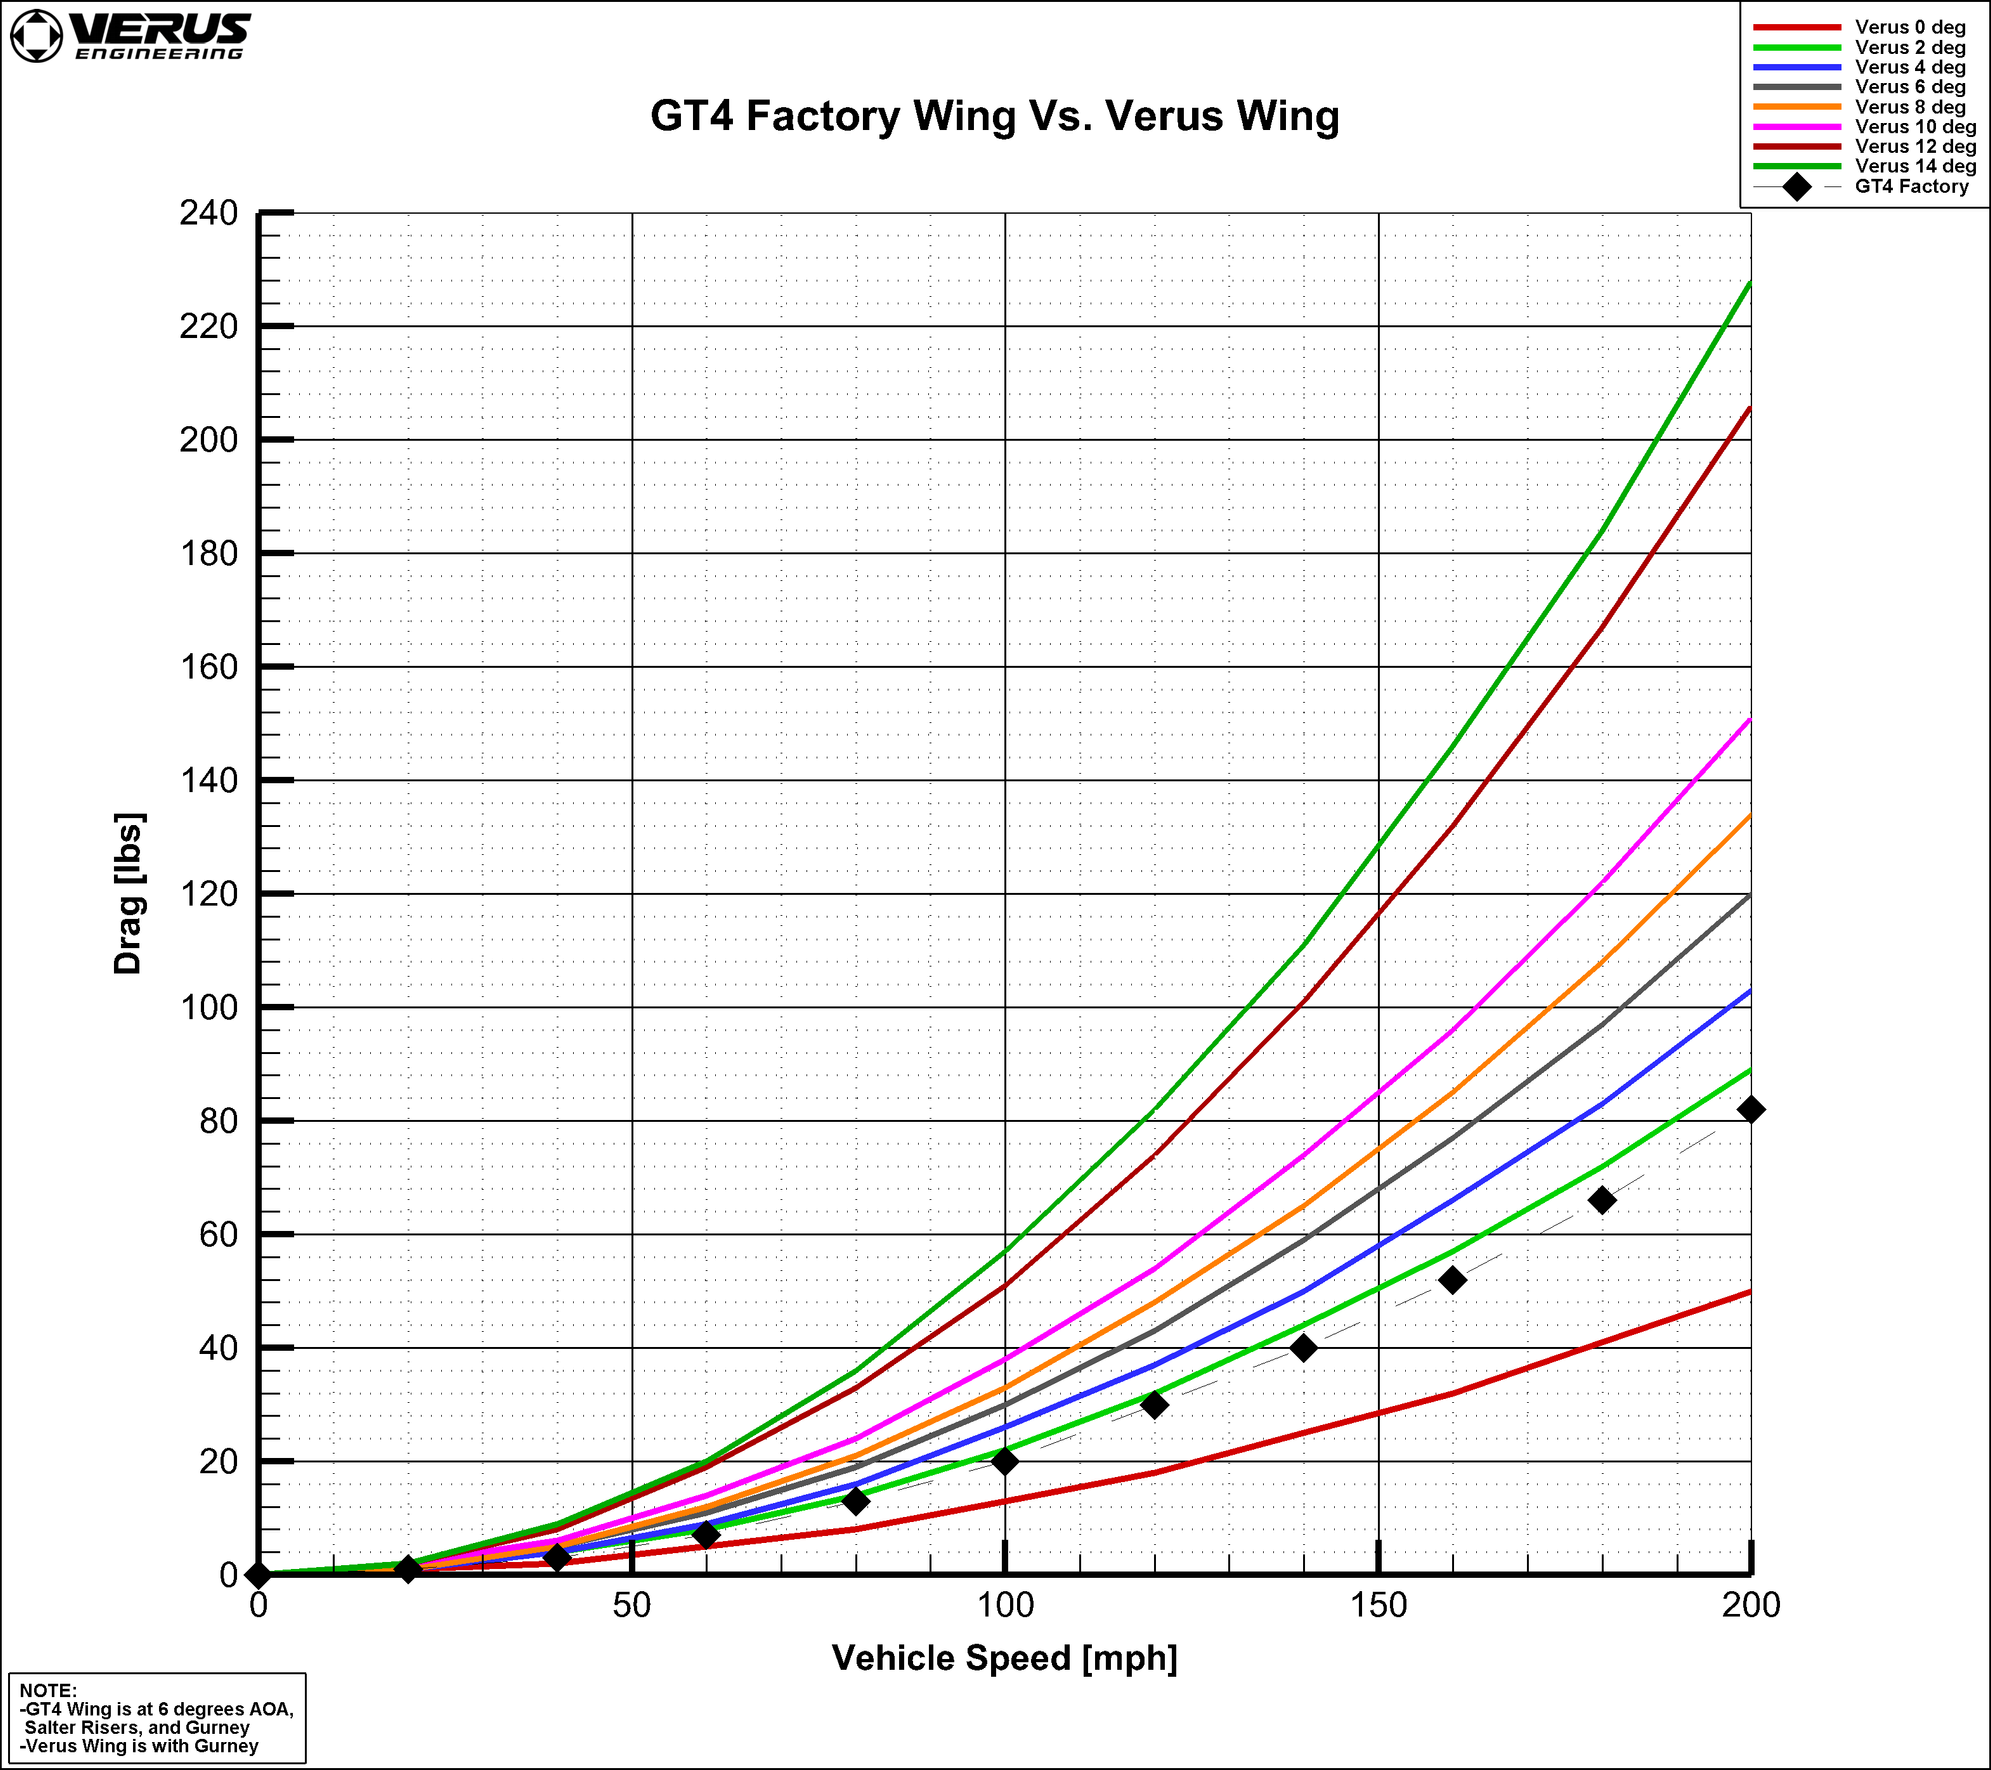
Drag Graph
As a former wind tunnel test engineer (and still heavily involved with it), nice to see some real data!
Seeing more downforce in that ideal scenario makes sense without the separated air coming off the roof on the actual car, but still very good comparisons. Any plans for repeating the test with a mockup of the car in front of the wing to better characterize its performance?
Also how close are you to the walls?
Seeing more downforce in that ideal scenario makes sense without the separated air coming off the roof on the actual car, but still very good comparisons. Any plans for repeating the test with a mockup of the car in front of the wing to better characterize its performance?
Also how close are you to the walls?
We are not close to the walls as it is an open jet. Our blockage ratio was right at 0.1 for max angle of attack, including the test sting.
#7
Nice data, and the GT4 stock wing reference is even in my configuration with Salter Aero riser and Gurney lip.  The down force numbers for the Versus wing are crazy high as AOA is adjusted! I know Porsche reinforced the hatch to support the factory wing, do we know the structural limits of what down-force the hatch can successfully support? Also the risers?
 The down force numbers for the Versus wing are crazy high as AOA is adjusted! I know Porsche reinforced the hatch to support the factory wing, do we know the structural limits of what down-force the hatch can successfully support? Also the risers?
Trending Topics
#8
Basic Sponsor
Rennlist
Site Sponsor
Rennlist
Site Sponsor
The GT4 wing has a variable AOA correct?
#10
Rennlist Member
No plans currently for a full-car wind tunnel test. The cost to benefit is not there for us yet. Most tunnels we see used would be inadequate for our needs. We would need a full-scale wind tunnel with decent blockage ratio, it needs a rolling road to capture the tire/wheel interaction with the underbody, and needs to have a height able to handle decent wakes off the back of the car with a good wing. The only tunnel remotely close that meets the requirements is wind shear which is currently out of our budget.
We are not close to the walls as it is an open jet. Our blockage ratio was right at 0.1 for max angle of attack, including the test sting.
We are not close to the walls as it is an open jet. Our blockage ratio was right at 0.1 for max angle of attack, including the test sting.
#11
Burning Brakes
Thank you for the comparison. This just puts everything in perspective as to how much down force your wing can generate. Quite amazing.
#13
Basic Sponsor
Rennlist
Site Sponsor
Rennlist
Site Sponsor
Very cool, Eric. Keep up the great data driven work!
-Mike
-Mike
__________________
SOUL PERFORMANCE PRODUCTS
Quality Exhaust Solutions, Fair Pricing, and Outstanding Service
John Gaydos- Owner, Performance Specialist
Cell - (484) 883-6197
johng@soulpp.com
Jon Wheel - Marketing Manager
jwheel@soulpp.com

SOUL PERFORMANCE PRODUCTS
Quality Exhaust Solutions, Fair Pricing, and Outstanding Service
John Gaydos- Owner, Performance Specialist
Cell - (484) 883-6197
johng@soulpp.com
Jon Wheel - Marketing Manager
jwheel@soulpp.com

#14
Burning Brakes
One more question. Is that the low or high position for the stock wing. Somewhere else it is stated that the low bolt is 5.3 degrees and the high bolt hole is 7.6 degrees. Which ever one that you did, can the other be easily calculated? Your wing creates so much more downforce.
#15
Nice data, and the GT4 stock wing reference is even in my configuration with Salter Aero riser and Gurney lip.  The down force numbers for the Versus wing are crazy high as AOA is adjusted! I know Porsche reinforced the hatch to support the factory wing, do we know the structural limits of what down-force the hatch can successfully support? Also the risers?
 The down force numbers for the Versus wing are crazy high as AOA is adjusted! I know Porsche reinforced the hatch to support the factory wing, do we know the structural limits of what down-force the hatch can successfully support? Also the risers?
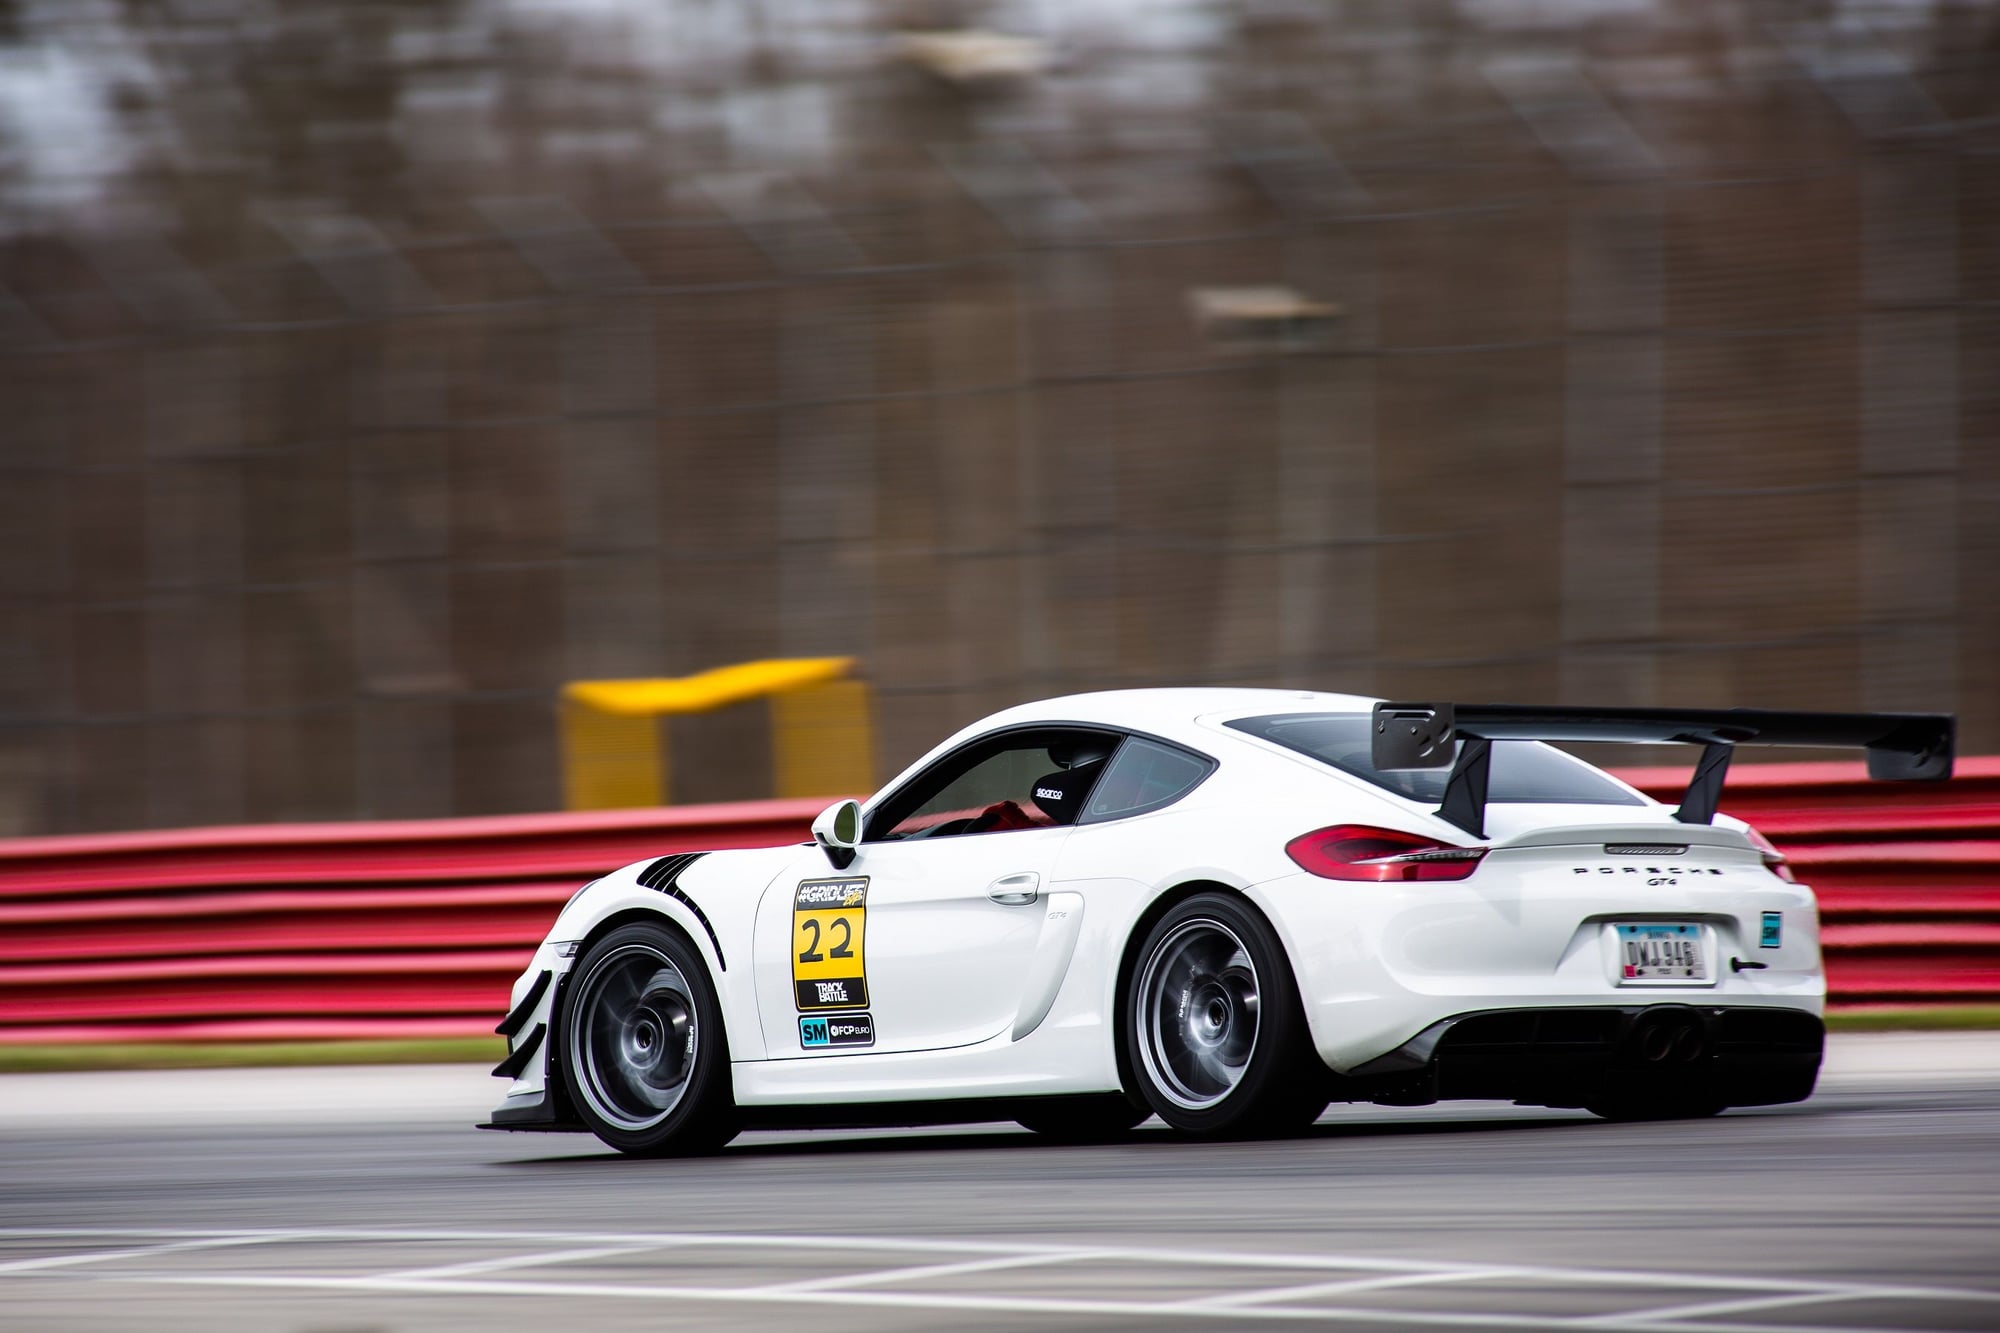
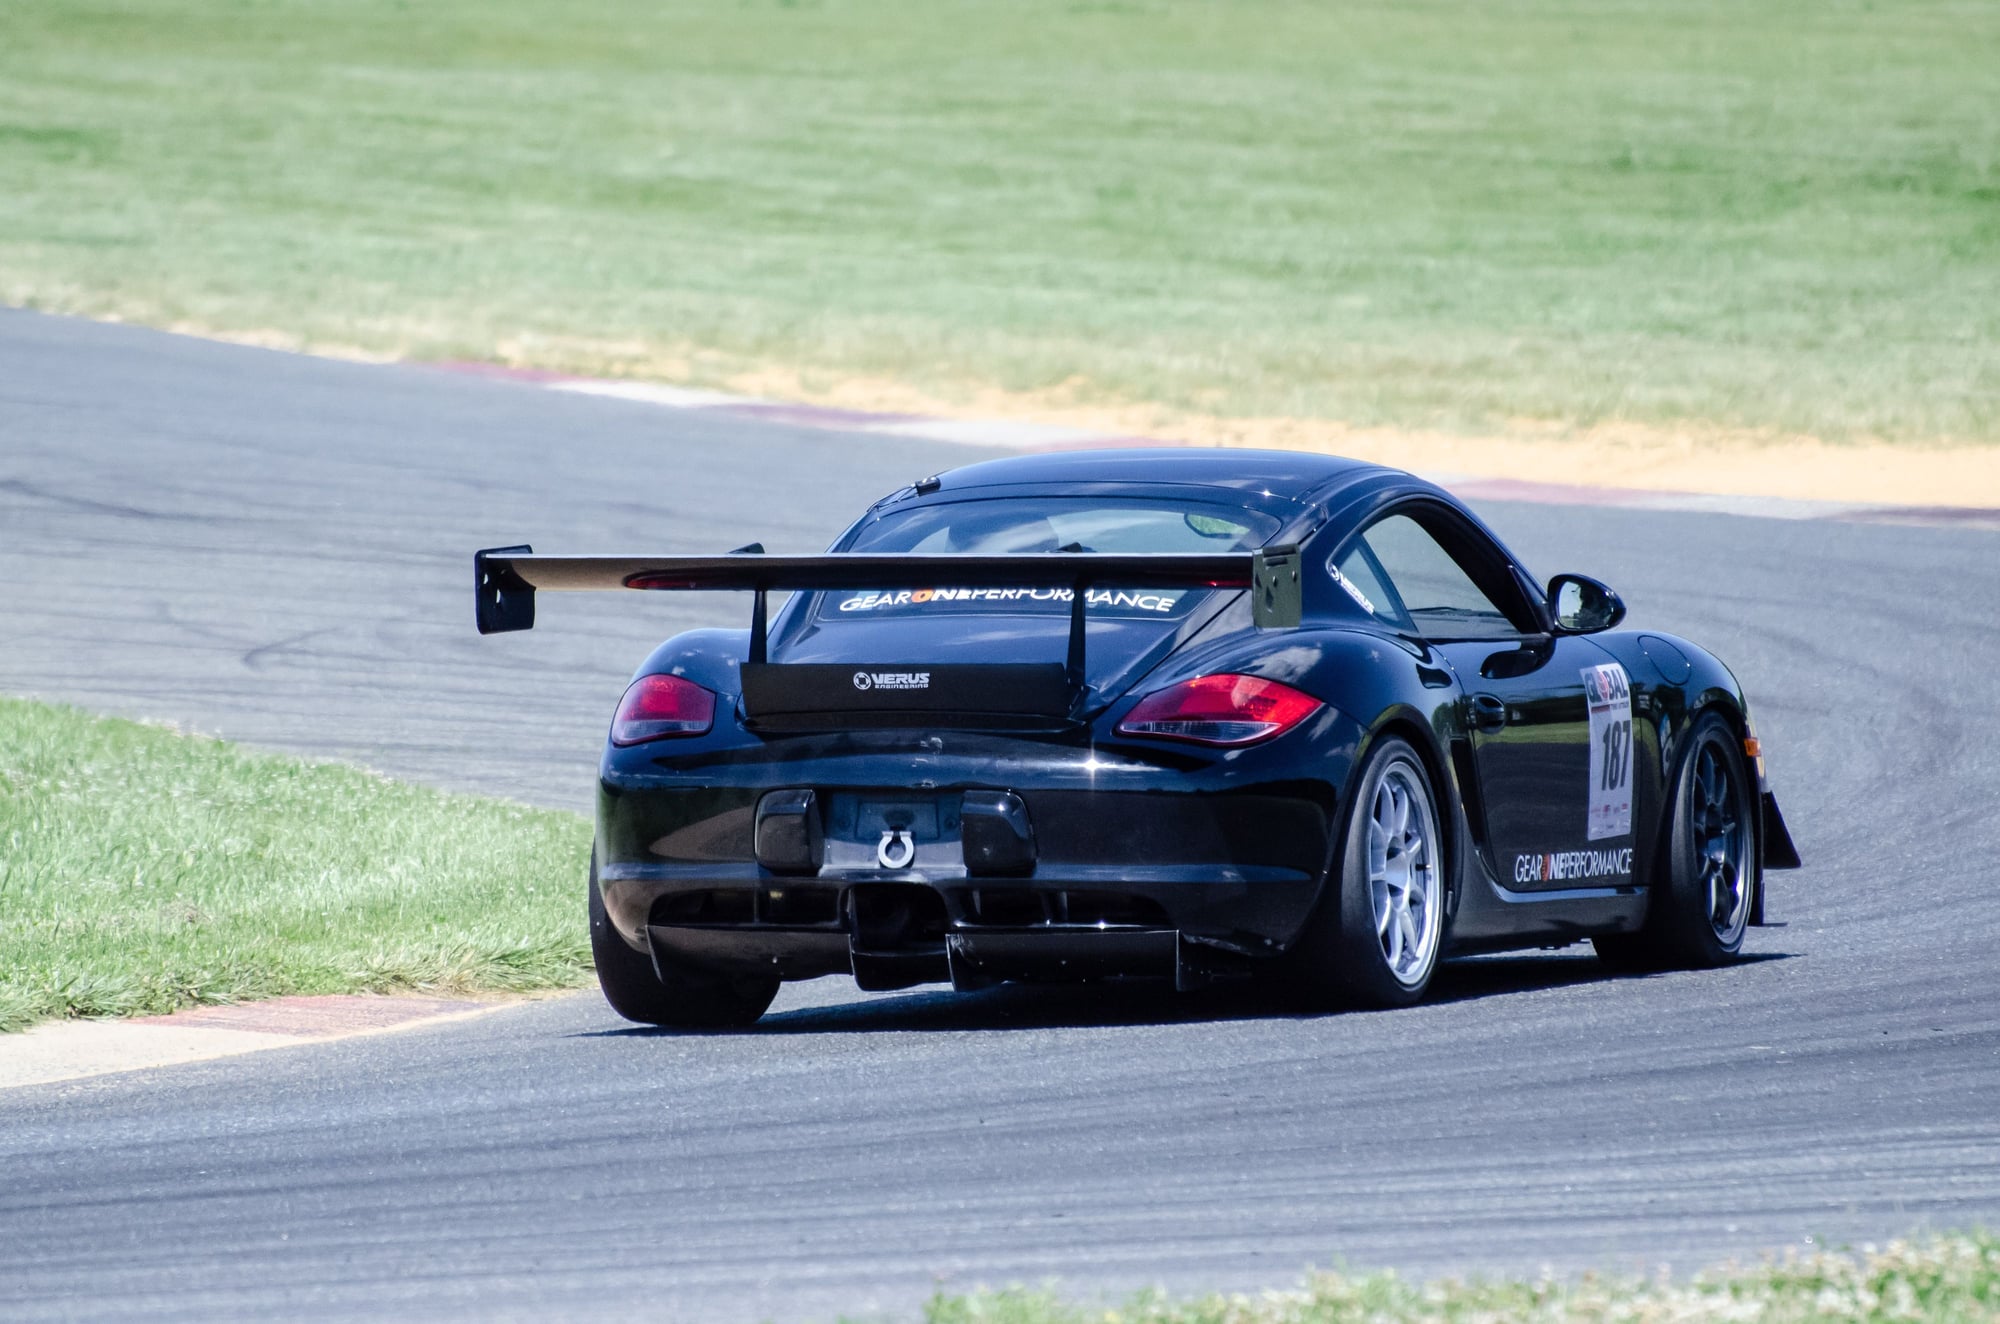
Jeremy at 9 degrees AOA
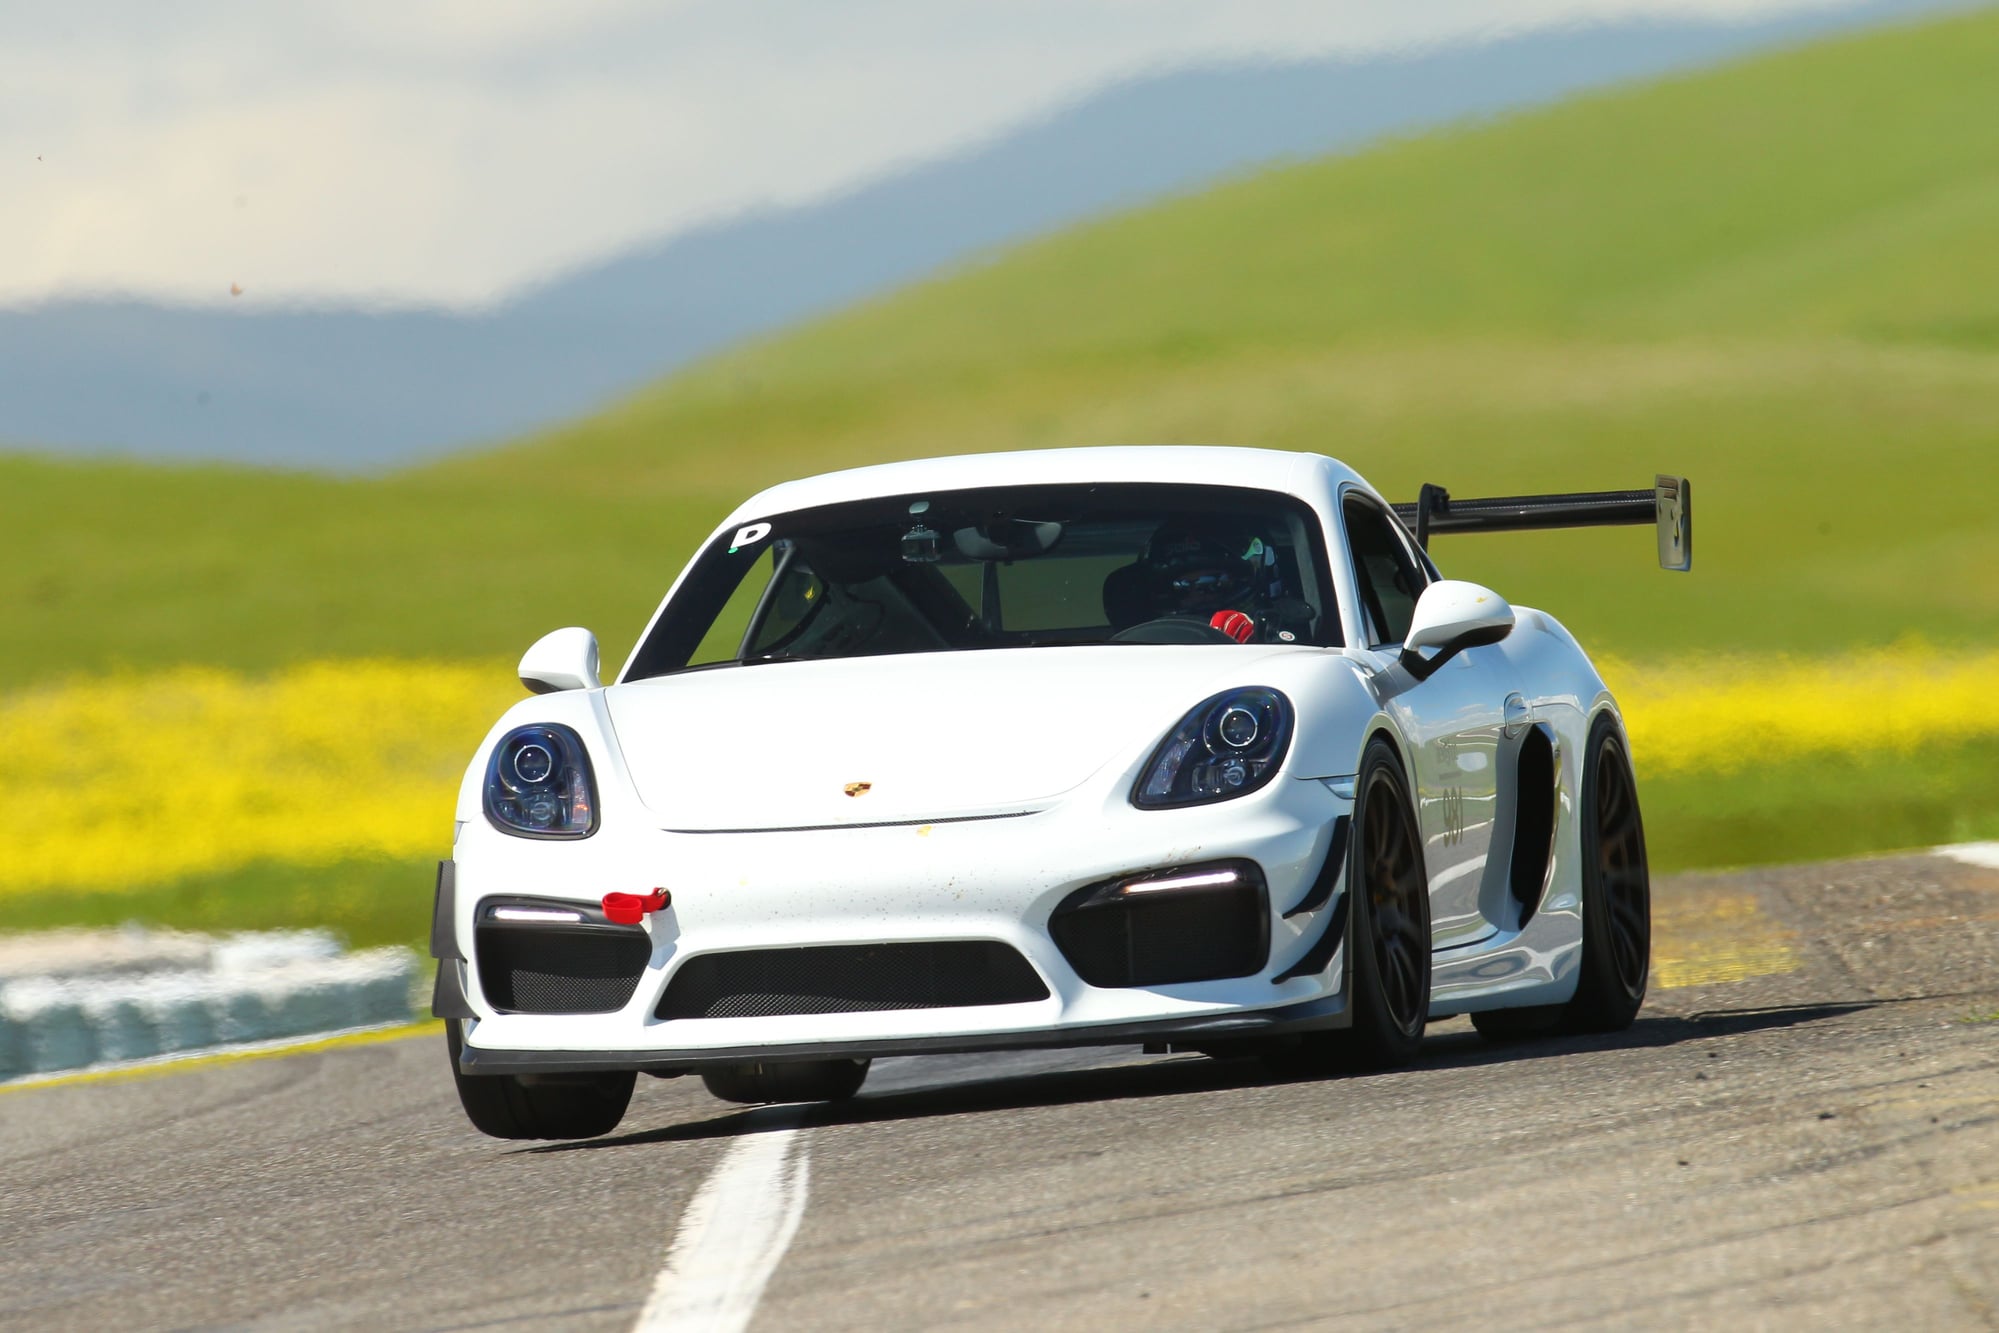
Aleks at 4 Degrees AOA
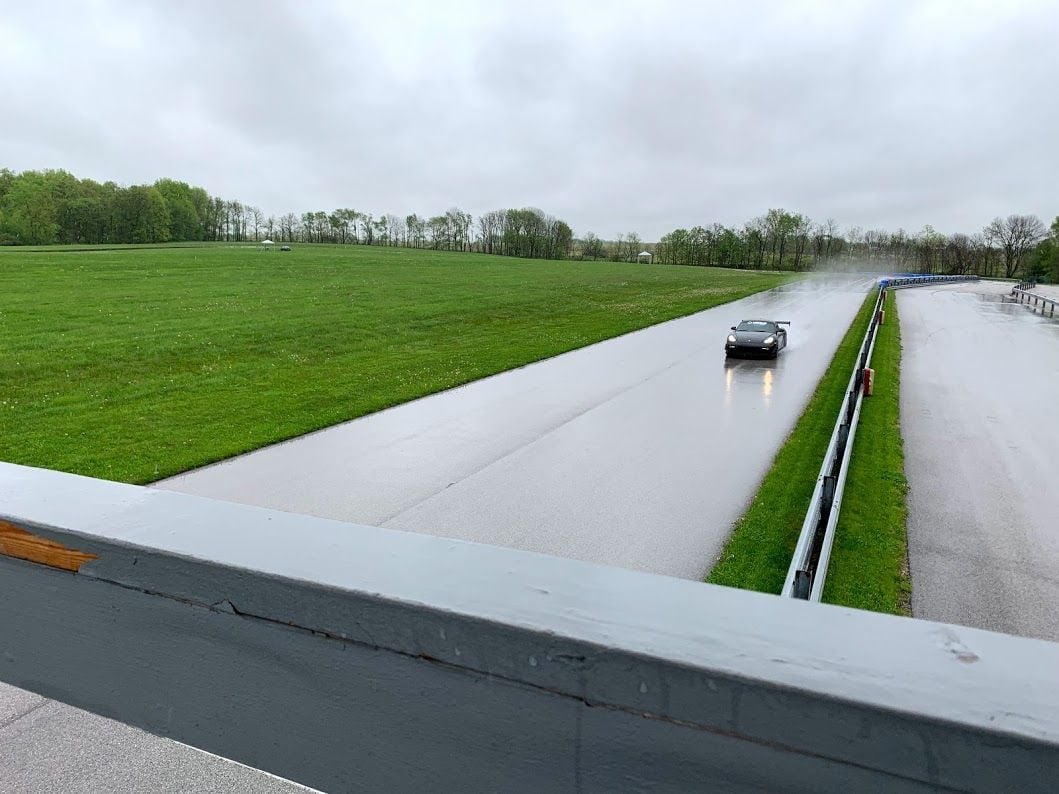
Shop 987 at 6 degrees AOA
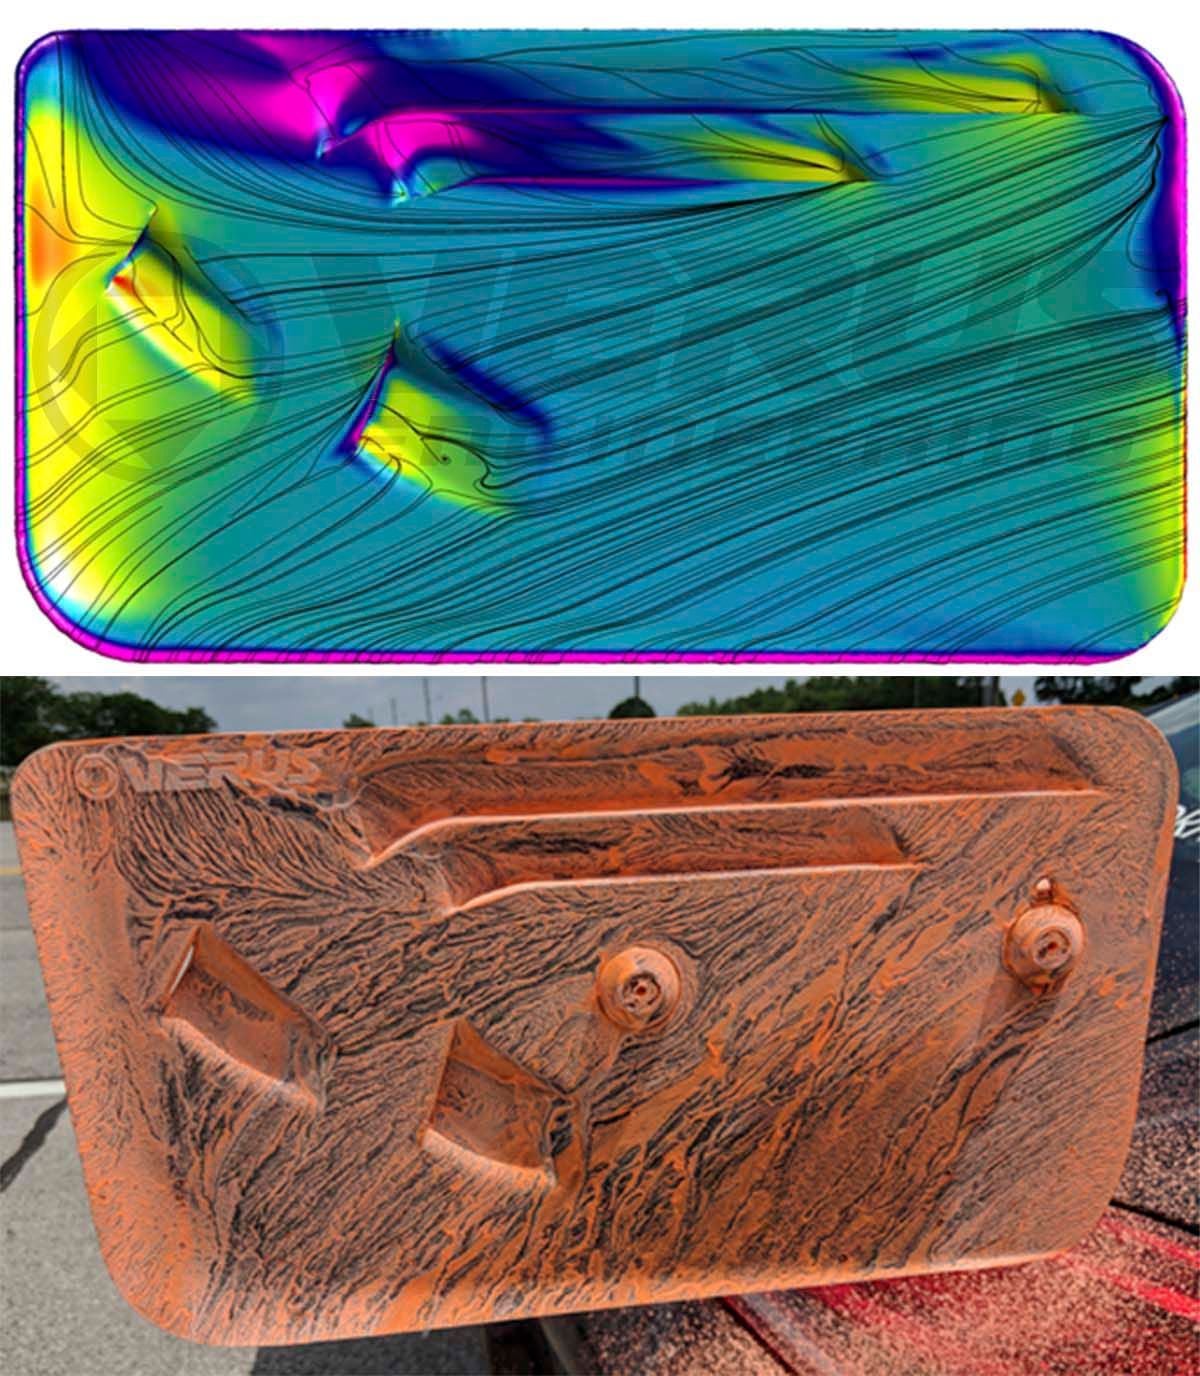
Thanks Mike; we'll do our best.
One more question. Is that the low or high position for the stock wing. Somewhere else it is stated that the low bolt is 5.3 degrees and the high bolt hole is 7.6 degrees. Which ever one that you did, can the other be easily calculated? Your wing creates so much more downforce.

