
Peak HP, Avg HP, or Area under the curve; which is the better measure of HP?
 10-21-2010, 02:13 AM
#31
Rennlist Member
You mean "torque" at the wheels, AFTER the gear box AND at any comparitive vehicle speed. 
Hey, I did have a faster time than Mark A had with the old "Estate" in our lemons races, albeit, very close though. 

 10-21-2010, 02:21 AM
#32
Rennlist Member
So this is where my original question on the other "Battle" came into play. Glen got it, and we were narrowing it down, and then someone brought in a hired physics Gun to try and dispell a genuine measurement of energy use over time, a Watt-second, or a Joule, or what I ended up kind of coining, a HP-second.
The HP-second is not a bad way to look at the HP curve for max performance, because it really takes all into account. averages done really do the job (integration) because the time spend in the higher rpm is longer, thus will have a weighted effect in a wheel to wheel race. plus, aero drag is greater at any higher speed too, and it goes up with the square of velocity.
So, in the end, shift points and comparing HP curves for which car will be faster, (all things being equal) is easy to do with HP curves. for shift points, get two equal points based on gear spacing. for more over all power, use HP-seconds, or take the average over the geared shift point spacing. in reality, the curves shown above all point to the higher HP engine having an advantage everywhere, but maybe for a second or so at the start of each gear, and possibly from a standing start, but that is an entirely different discussion.
acceleration = power/(mass x velocity) acceleration is proportional to power, and is inversely proportional to speed.
mk
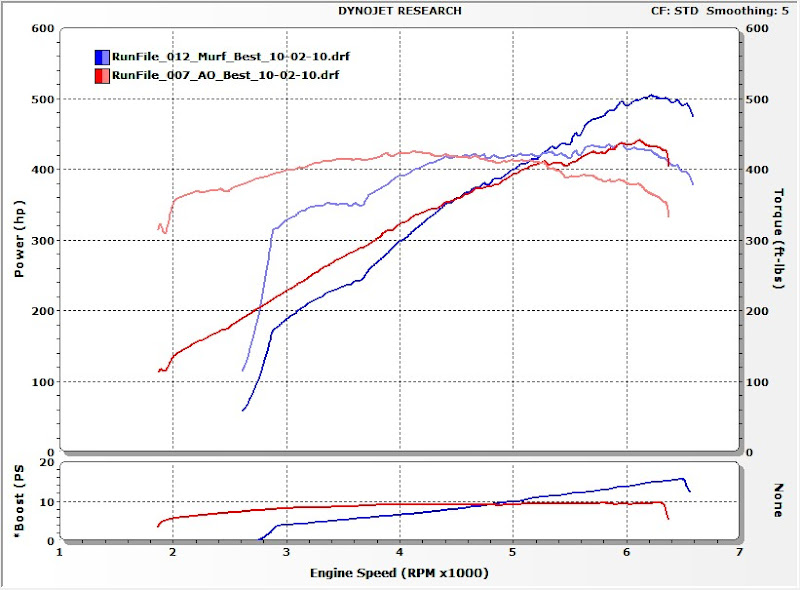
In case you didn't see it, in the recent "Sharks in Titletown" thread, I posted dyno results of 443 RWHP and Murph posted 507 RWHP.
As you can see in this graph, I have more HP lower in the RPM range.
So I was wondering which is the best measure for engine performance?
Peak HP?
Average HP?
Area under the curve?
Peak HP
Obviousvly Peak HP is not a very good measure becasue it only tells you about a maximum value and does not describe the overall performance of the engine.
I suppose I should take a step back and say that in no way am I trying to knock the Murf car. IT IS A FAST CAR! But the drag race we had on the way to the dyno showed the cars very equally matched, so I'm trying to better understand how to get a better measure for this.
Average HP
I exported the dyno results from both my best run and Murph's into Excel and looked at the average HP produced over the same range: 3,000 RPM to 6,300 RPM.
It turns out the average RWHP for my car over this RPM range was 358 RWHP. For Murf it was 355 RWHP.
This explains why the car are so equally matched. 3 RWHP difference. Amazing!
Are Under the Curve
I took it a step further and decided to see if I could calculate the area under my HP curve and Murf's. The results were interesting.
I plotted the exported data (again using 3k RPM to 6.3kRPM) in excel and told it to give me a 2-polynomial trend line based on the data. Both curves had r-squared values of 0.98 or grater. (The closer to 1, the closer the representation of the trend line to the actual data)
For Murf the equation was y=-0.132x^2+14.32x+159.38
Mine was y=-0.1391x^2+11.308x+213.05
When i take the integral of these (actually I cheated and plugged them into a solver) I get the area for Murf's to be 166.451 and 218.66 for mine. These seems to be wrong on it's face, but I can't remember my calculus, so it could be the solver is wrong.
I'm not sure if this really tells all that much, but thought I would throw it out there for comment.
So which is the better measure?
10-21-2010, 02:46 AM
#33
Race Director
I did have "FTD" (albeit a slow one) at the end of the day Saturday at our 1st race!!! Of course both "marks" were a couple seconds better on Sunday before the engine blew
However MK did have the single best lap at Sears...one of the fastest of the whole race....I think only the V8olvo with their best driver was faster... We did manage 173 laps on Sunday....only Eyesore and V8olvoi did more with 175 a piece!!! Not bad considering we had overheating problems and weren't pushing hard....
10-21-2010, 03:44 AM
#34
Rennlist Member
Join Date: Dec 2002
Posts: 1,051
Likes: 0
Received 0 Likes
on
0 Posts

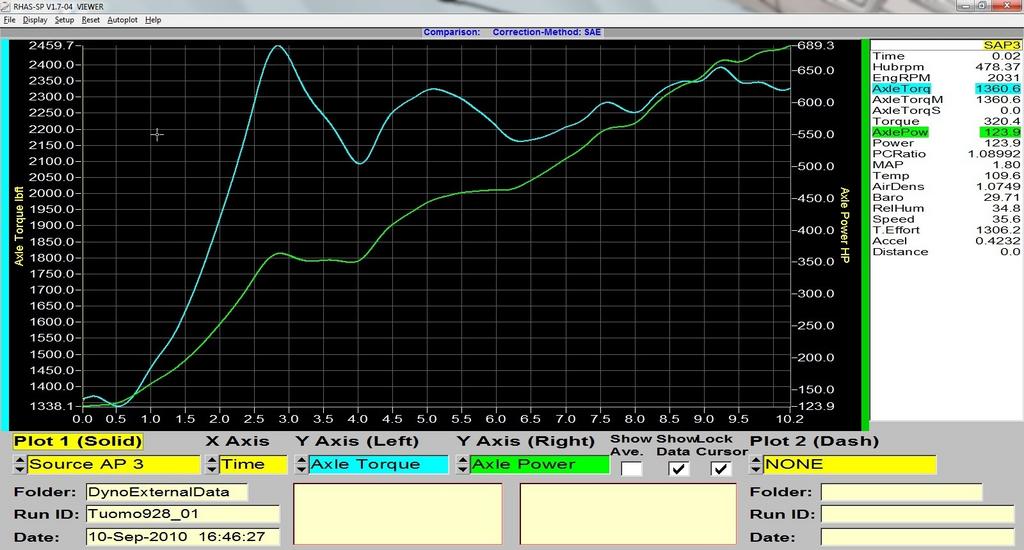
A more accurate assessment of the engines would be if the area under the curves for each subsequent gear was calculated, and the sum of all of them them up until the maximum speed reached was compared. Basically use the chart Andrew posted for first gear, and then a chart more like the one below for 2nd, 3rd, etc., add all of those area values together, and compare those final total area numbers.

Maybe the higher torque down low vs higher horsepower up high issue can be clarified a little more by showing examples of each scenario.
High low RPM torque and low high RPM horsepower:

Low low RPM torque and high high RPM horsepower:

 10-21-2010, 07:28 AM
#35
Banned

Join Date: Aug 2010
Location: Butler PA
Posts: 59
Likes: 0
Received 0 Likes
on
0 Posts
")
You really need a new shtick, this one is getting old. You have more screen names in this place than I have posts.
How about Shane's 86.5 - same dyno @ correction factor
473hp/403tq @ 11.22psi
How about Jim Robert's GT (without an IC) - same dyno & correction factor
513hp/433tq @ 12.00psi
Maybe there is more to the tune in Tim's automatic than you realize or are able to comprehend.
Shane's car made more power on that day, it was dialed back before the final pull (shown above), without changing the boost.
Newsflash Mark - there is more to the HP/TQ numbers than boost. Maybe someday you'll realize this. You might want to figure this out before you start tuning your newly megasquirted car.
Here is the chart to refresh your memory:
-
 This is getting good
10-21-2010, 08:04 AM
This is getting good
10-21-2010, 08:04 AM
#36
Nordschleife Master
Really dyno's don't mean a damm thing.....its just a number guys can bench race with...... the only way to determine whose car is faster is to RACE.....the winner "might" have the faster car....or just is a better driver... But whats funny is ALL of these 928's would loose a drag race against Anderson's racer...even Todd's mighty 675whp can't touch Andersons 500+whp in only 2600lbs... 5-1 power to weight is pretty good....
Also, since this has turned into a dyno bragging thread, I'll jump in. Anyone with a higher average hp between **** points than mine? I am eyeballing 540 axle hp between 4400 and 6600. ;-)
Of course, the above is from a tuning session with a non-standard dyno (Dynapack) with many things going on. The car will make more than 600 peak and more than 500 average axle hp no matter how I slice it, though.
I'll try to hike to Malden one of these days to get Dynojet data file just so it's comparable. Will probably have to wait until John (Speake) and Niklas deliver the new custom EZ-K software, though.
10-21-2010, 10:54 AM
#37
Nordschleife Master
10-21-2010, 12:54 PM
#39
Rennlist Member
Actually, its true, after 1st gear where there can be debate on actual power or torque, or really "forces" applied to the wheels for a few seconds, after that IT IS NOT GEARING that will give a unconditional advantage, it is average HP or Hp-seconds you can put to the wheels. with gearing, there is overlap, so it really depends on the range of speed you are operating at. in otherwords, just before the 1st gear shift, any two gear sets can have an advantage over another. If your top speed in a 1/4mile run might be 118mph, you might want the 2.2 :1 gear set to have better overall power to the wheels and therefore torque AT the wheels overall. if that top speed based is expected to be 100mph, then the 2.75 gear box might be best, just as it might be best if the top speed might be expected to be 140mph.
The graph above, shows a little bit of the trade offs.
If you use average power over a RPM range that will be used, you are 95% there as far as being truely correct. peak HP doesnt do it, and I have video racing examples to show why that is true. average HP over any range of speed is certainly the closest way to approximate comparitive performance in reality.
10-21-2010, 01:06 PM
#40
Rennlist Member
Yep, he was in the 490rwhp average with his last dyno run.
to your point, i was racing the 420rwhp S2000s with blowers , and with their peaky HP curve, (and flat torque curve ) I would actually not only hang with only 370rwhp, i would out pull them overall in each gear. why??? HP-seconds were greater than the peak hp would first indicate. or looking at aveage HP , I was near 360rwhp and they were only near 350rwhp AVERAGE, over the cars RPM shift point range.
want to see the drag races, the are on my videos on youtube. Sears point '08, when the stroker motor first went in. first race day with it.
to your point, i was racing the 420rwhp S2000s with blowers , and with their peaky HP curve, (and flat torque curve
) I would actually not only hang with only 370rwhp, i would out pull them overall in each gear. why??? HP-seconds were greater than the peak hp would first indicate. or looking at aveage HP , I was near 360rwhp and they were only near 350rwhp AVERAGE, over the cars RPM shift point range.want to see the drag races, the are on my videos on youtube. Sears point '08, when the stroker motor first went in. first race day with it.
10-21-2010, 01:08 PM
#41
Rennlist Member
+1 !!!!
"Best" depends on the application. The best is the one that has the greatest area under the curve, for the range that it's used in the most. That's also assuming that both cars are geared the same if trying to make a performance comparison based on dyno charts. Even if gearing were the same, one of the problems with trying to make comparisons using area under the curves the way that it was above, is that it only compares what would occur in first gear in a drag race. Once first gear is over with, neither car is ever back down in the low RPM area again, so what happens there is irrelevant in every gear beyond that. Here's the RPM data of the G-Tech runs of both of the cars. After about the first 2 seconds of first gear, neither one of them ever gets to below about 4,250 RPM ever again. The data also shows Andrews lower overall gearing in each of the three gears, meaning he'd have greater torque at the rear wheels due to the torque multiplication through the drivetrain, even if both engines were making the same torque at comparable points.
A more accurate assessment of the engines would be if the area under the curves for each subsequent gear was calculated, and the sum of all of them them up until the maximum speed reached was compared. Basically use the chart Andrew posted for first gear, and then a chart more like the one below for 2nd, 3rd, etc., add all of those area values together, and compare those final total area numbers.
So to compare your car to a 951, you pull off four plug wires and only use four cylinders?
Don't forget that the centrifugal car has an automatic transmission, with higher drivetrain losses than the twin screw car with it's 5-speed. The centrifugal car is also an S4, compared to the twin screw being a GT, so there are differences in the basic engines to start with as well.
Dyno results can mean a lot. When all things are considered and interpreted correctly, they can make it an awful lot easier to win an actual race. You are right about the race being the real objective though. I have yet to see the hot looking girl give the trophy and giant check to the guy who won a bench race, or who's car may have seemed to feel faster using the seat of the pants method.
Maybe the higher torque down low vs higher horsepower up high issue can be clarified a little more by showing examples of each scenario.
High low RPM torque and low high RPM horsepower:
Low low RPM torque and high high RPM horsepower:
10-21-2010, 01:11 PM
#42
Rennlist Member
There is a tremedous argument in favor of using average HP. it solves 95% of the problems here .
Wow! Cool discussion.
Had to start paying the bills right after I posted this.
What I was really trying to understand was whether peak, avg, or area was a "more" accurate way to compare engines.
All the points are generally excellent points (except for Turbo Mark - wasn't he banned?), and I guess it really does come down to how you define the parameters. Sorry my bad for not defining those more clearly.
As for the suspect equations, I didn't set the intercept at zero becasue you can't dyno the car from 0 RPM.
I'm still at work and need to go home and get some sleep, I'll revisit the thread tomorrow if I have time, or Friday when I will for sure.
10-21-2010, 01:47 PM
#43
Drifting
I look at it as such, I spend the majority of my driving under 5000 rpm. I would think you would need to calc just the area under the curve you really use. bench racing is just that. I would think the murphy ride would "feel the most powerful and fastest if you were always driving very high in the rpms. otherwise the twin screw, stroker etc would feel the most powerful when driven . Now adding a centrifugal to a stroker....HMMM the best of both?
I love reading everyones input because I don't know physics like you guys do and your opinions are really cool to read .
I love reading everyones input because I don't know physics like you guys do and your opinions are really cool to read .
10-21-2010, 04:00 PM
#44
Rennlist Member
Side questions to the shift points "Z" posted:
1) Murph's 1st gear shows ~6350 rpm - how did he get it to shift that high in 1st, when it seems most auto's shift much earlier than that ? Search of past posts suggests 1-2 shift somewhere around 5600rpm +/- 200rpm ??
2) 3rd to 4th is only ~6k rpm - mis-shift? or already in "D"?
3) Conversely, it looks like Andrew short-shifted to 2nd (wheel spin?), hit the rev limiter in 3rd, but overall maintained a lower rpm floor of ~4800rpm vs- Murph's 4250rpm ==> doesn't this suggest that Andrew's GT would be better suited for a CS setup? and an AT to a TS?
[not touching CS vs- TS variables like cost, install complexity, aesthetics, etc, just the data shown here]
10-21-2010, 04:40 PM
#45
Race Car
Join Date: Jul 2009
Posts: 3,570
Likes: 0
Received 0 Likes
on
0 Posts
the only way to anaylze this is the convert rev/min to rev/sec and integrate torque over a given range...
this will yeild W/t or P
HP-sec, etc., are useless
but as someone said, run them side by side and all doubt is removed...
btw: you don't need a calculator to integrate an exponential
int(x^n) = 1(n+1) x^(n+1)
example:
int(3 x^3) = 3/(3+1) x^(3+1) = 3/4 x^4
check: deriv(3/4 x^4) = 4 3/4 x^(4-1) = 3 x^3