

Peak HP, Avg HP, or Area under the curve; which is the better measure of HP?
 10-20-2010, 05:08 PM
#1
Supercharged
Rennlist Member
Rennlist Member
Thread Starter
Join Date: May 2002
Location: Back in Michigan - Full time!
Posts: 18,925
Likes: 0
Received 63 Likes
on
36 Posts
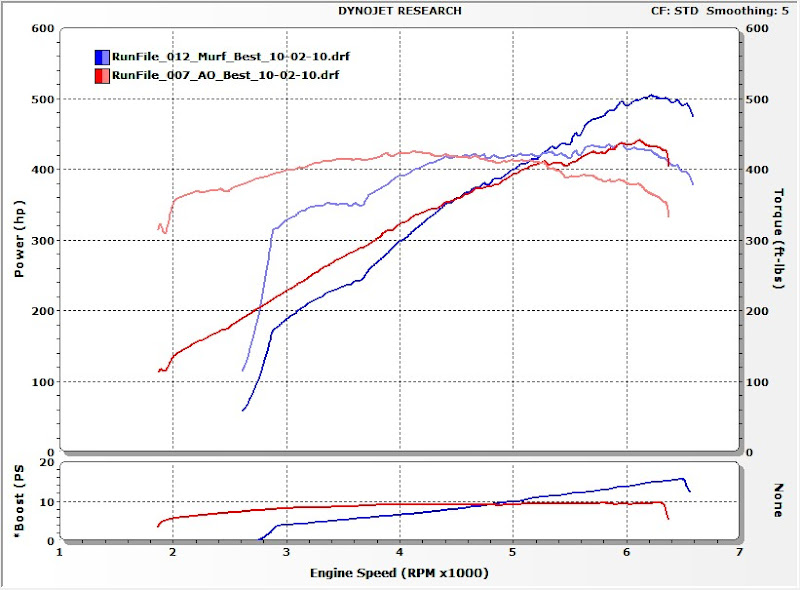
In case you didn't see it, in the recent "Sharks in Titletown" thread, I posted dyno results of 443 RWHP and Murph posted 507 RWHP.
As you can see in this graph, I have more HP lower in the RPM range.
So I was wondering which is the best measure for engine performance?
Peak HP?
Average HP?
Area under the curve?
Peak HP
Obviousvly Peak HP is not a very good measure becasue it only tells you about a maximum value and does not describe the overall performance of the engine.
I suppose I should take a step back and say that in no way am I trying to knock the Murf car. IT IS A FAST CAR! But the drag race we had on the way to the dyno showed the cars very equally matched, so I'm trying to better understand how to get a better measure for this.
Average HP
I exported the dyno results from both my best run and Murph's into Excel and looked at the average HP produced over the same range: 3,000 RPM to 6,300 RPM.
It turns out the average RWHP for my car over this RPM range was 358 RWHP. For Murf it was 355 RWHP.
This explains why the car are so equally matched. 3 RWHP difference. Amazing!
Are Under the Curve
I took it a step further and decided to see if I could calculate the area under my HP curve and Murf's. The results were interesting.
I plotted the exported data (again using 3k RPM to 6.3kRPM) in excel and told it to give me a 2-polynomial trend line based on the data. Both curves had r-squared values of 0.98 or grater. (The closer to 1, the closer the representation of the trend line to the actual data)
For Murf the equation was y=-0.132x^2+14.32x+159.38
Mine was y=-0.1391x^2+11.308x+213.05
When i take the integral of these (actually I cheated and plugged them into a solver) I get the area for Murf's to be 166.451 and 218.66 for mine. These seems to be wrong on it's face, but I can't remember my calculus, so it could be the solver is wrong.
I'm not sure if this really tells all that much, but thought I would throw it out there for comment.
So which is the better measure?
 10-20-2010, 05:15 PM
#2
Administrator - "Tyson"
Lifetime Rennlist
Member
Lifetime Rennlist
Member
None of the above, go to a track and see who crosses the line first.
What is the point of all these modifications? Going faster, so that's really all that matters.
What is the point of all these modifications? Going faster, so that's really all that matters.
10-20-2010, 05:22 PM
#3
Still plays with cars.
Lifetime Rennlist
Member
Uh-Oh.....
10-20-2010, 05:33 PM
#5
Addict
Rennlist Member
Rennlist Member
At first glance, those equations look suspicous to me.
Plug in x = 0 RPM, look at the corresponding y numbers (159 HP and 213 HP), and compare that to a quick visual extrapolation of your HP curves from 3 k RPM to 6.3 k RPM.
Doesn't look right to me. Then again, your equation omits units (ruler slap to knuckles), so I'm not sure what it represents.
Plug in x = 0 RPM, look at the corresponding y numbers (159 HP and 213 HP), and compare that to a quick visual extrapolation of your HP curves from 3 k RPM to 6.3 k RPM.
Doesn't look right to me. Then again, your equation omits units (ruler slap to knuckles), so I'm not sure what it represents.
 10-20-2010, 05:35 PM
#7
In the GT..you wouldn't be spending much time below 4000 rpm...... Only in a drag race or street race would you have an advantage (small one..since time spent below 4k is really short)...
I would think area under the curve would give you a better overall idea of how the car performs......but it all depends on what you are trying to do with the car...each evaluation method has its advantages...
I would think area under the curve would give you a better overall idea of how the car performs......but it all depends on what you are trying to do with the car...each evaluation method has its advantages...
Trending Topics
10-20-2010, 05:37 PM
#8
Addict
Lifetime Rennlist
Member
Lifetime Rennlist
Member
There is no correct answer. All are equally good. It all depends on your definition of engine performance. It all depends on driving conditions. That being said, the area calculation with a very rough calculation comes to about 1.200.000 NMRPM for Murf's car and 1.176.000 NMRPM for your car.
10-20-2010, 05:38 PM
#9
Administrator - "Tyson"
Lifetime Rennlist
Member
Lifetime Rennlist
Member
10-20-2010, 05:45 PM
#10
Addict
Rennlist Member
Rennlist Member
Come to think of it, if you've got raw numbers, just sum your trapezoidal areas and divide by the RPM range covered. Why lose precision by going through a low-order polynomial curve fitting exercise?
And... besides, none of this means jack s#$@ unless we know which one of you was using Amsoil.
And... besides, none of this means jack s#$@ unless we know which one of you was using Amsoil.
10-20-2010, 06:37 PM
#12
Race Director
torque torque torque.....well that and gearing is all that matters........................
Okay that should get MK's attention
Here is my theory....it all depends on what you want to do with the car.....for a "street" car I would take the TS power curve....sure it lacks a bit of top end punch, but would be more spirited at lower rpm due to its wider power curve....now for a race car...where you want power between 4-6k rpm...the murf is better....
10-20-2010, 07:32 PM
#13
Rennlist Member
It seems Andrew is clearly talking about a street driven car...so, "Which is a better measure" depends on how YOU drive.
Many owners won't spend much time downshifting to 5k rpm getting onto the freeway, so "their" average hp is likely more applicable than their peak hp.
I do enjoy the downshift (to scare the M6 into thinking he's in trouble), so peak hp has relevance for this playtime.
However, Gearing (relevant to redline and then up-shift) absolutely has to be considered. I think a significant number of owners do hit WOT in the first 3 gears sometimes, so average hp in the usable rpm range is very applicable. The AO/Murph experiment illustrates this.
Some owners enjoy short sprints within gears, clearly pointing to peak hp relevance while being in the right gear. Make sure to pick YOUR right gear for the jump and the benefit sways in your favor.
Overall, average hp is a better measure, to Andrew's question, when considering how most drive, IMHO. A driver is more likely to just "stick his foot in it" and leverage average hp, than prepare/calculate when to start playtime with strategy that favors his peak hp and gearing.
That said, there has to be value in Murph's peak hp curve for owners getting into that much power after bolting on boost. Kind of a reality check, but the driver can receive a smooth ramping build of power to learn how to handle it, rather than just receive a huge kick in midrange...think "oops, I downshifted, stabbed it and the *** end came around on me". Learn to drive the 500+ hp, calculate when to use it as you learn, and the end result will be the ability to drive a very fast car...fast. Applies to any FI adder. Perhaps for a TS, a little bit more attention is demanded right away since more hp is on tap at "normal" rpms.
Average hp is more relevant for the typical street driver. IMHO.
10-20-2010, 07:37 PM
#15
Addict
Rennlist Member
Rennlist Member
From my take, your car should have a quick 0-60, but Tim's car should have a higher top
end (probably by 25-30 mph). Your car would be limited by red-line and Tim's car would
be limited by horsepower. This is assuming you have stock gearing (2.73:1 for the GT and
2.2:1 for the S4). For my application (ORR) Tim's car would be a better choice. For other
applications I'd leave it to the experts in those areas.