When you click on links to various merchants on this site and make a purchase, this can result in this site earning a commission. Affiliate programs and affiliations include, but are not limited to, the eBay Partner Network.
So I decided to take baby steps in to data. figured before going full VBOX I'd get a Solo2 and gopro, see what I learn. From there, decide if I'd take the time to dissect more advanced data if I had it. As I look through the data, I see things of interest, but it's making me wonder, for others that dig into their data, what do they look for? so figured I'd put it out there for those that want to weigh in.
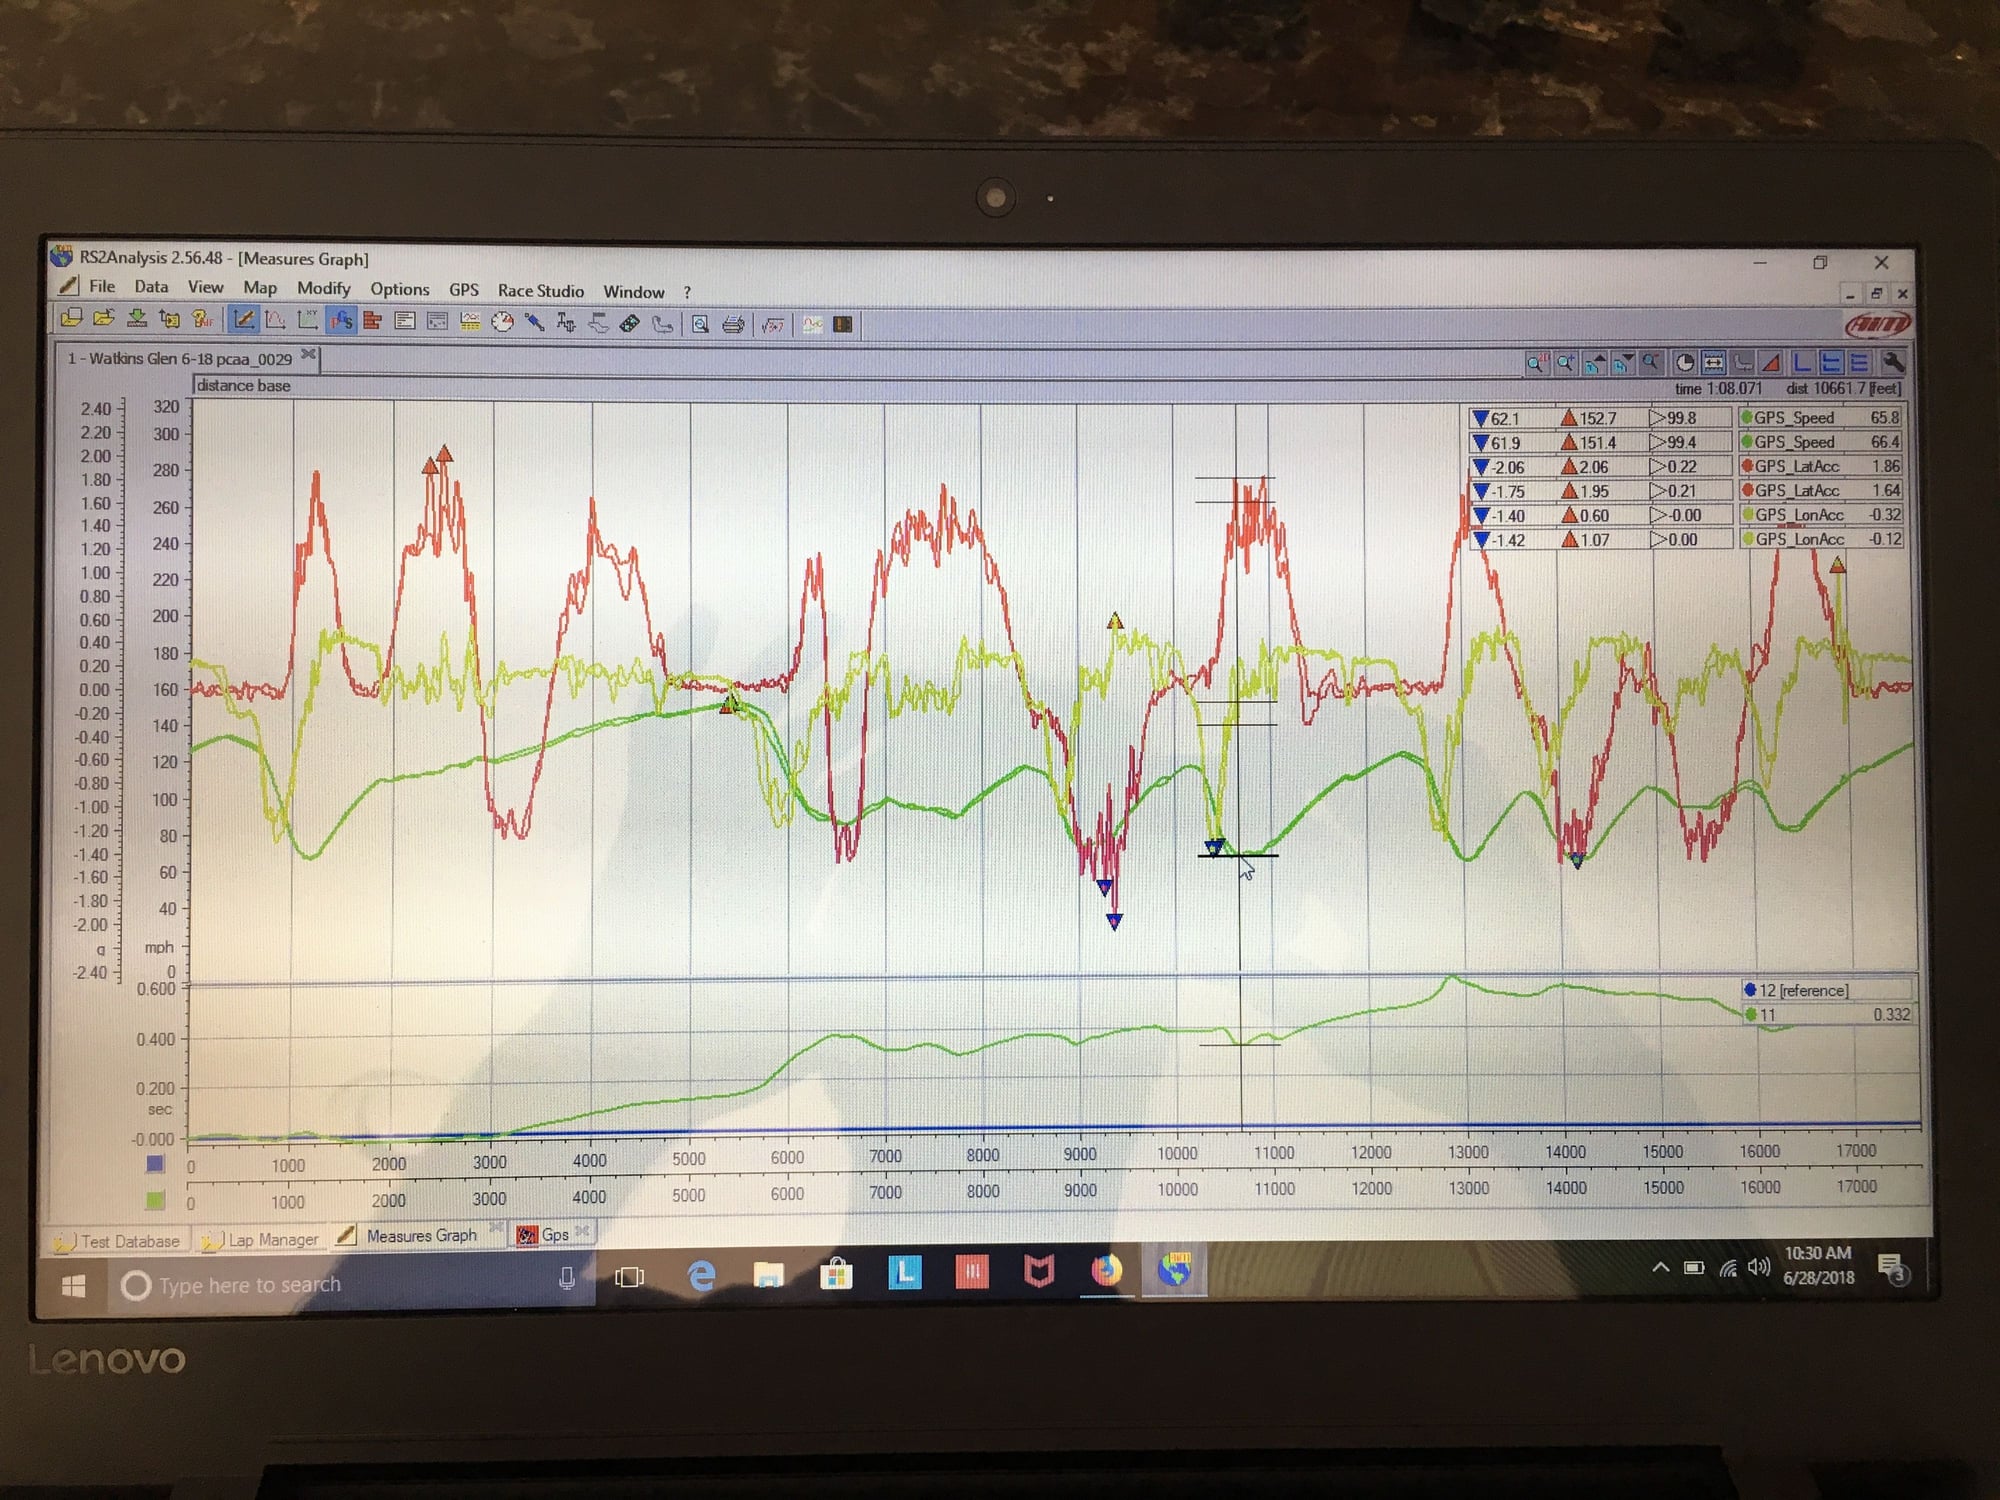
The graph is a two laps back to back laps from CVRPCA DE at Watkins 6/19. The times were 2:01.01 and 2:01:46. Seems like I lost a bit of time going into the bus stop and into turn 8. I'd have to check video to see if I was working on passing someone there (so yup, made me realize this would be more evident if I synch'd my Gopro video).
But I guess the question, for those that use their Aim data to improve, what do you look at or what do you see here? open to input
If you send me this AiM file, I�ll manipulate it, take screen shots and tell you exactly what I�m looking at to do a cursory analysis... the hook is I�ll post them here for all to benefit.
It looks good, but it looks TOO smooth in spots with SOME control inputs.
no problem with you posting what you find, at all. do I just do a "data Export"? then format - excel?
No. Go into Test Database, Select (highlight) the two �tests� (sessions) that you�re comparing in the strip chart you put up the screenshot of, right click and select �Export� saving these files to a folder on your desktop.
Open your email browser and attach all eight files in that folder to an email and sent it to the email listed on my site or under my profile. Can�t send through a PM, has to be attached to an email.
You can also right click and choose to email the test. Then change the email address to whoever you want to send it to.
On my phone, I see opportunity in brake application and release. Speed traces should have a "saw tooth" drop off (in general) and long g should have a nice smooth decline from max to none.
I'm sure Peter will post up some great info from his screenshots.
Yup Matt, thanks. in the speed trace, you're seeing that I tend to coast just before the brake zone rather than full throttle till brake application. especially the downhill into turn 1.
Yep. I told him it would be after IMSA and Chin Track Days VIR this weekend before I could post something up. But your advice would fix a lot of this! <grin>
And part of this is hopefully sharing a simple �Basic AiM Self Coaching� or �AiM for Dummies� workflow so others can duplicate it. The nice thing is the tenets for this apply to all data systems and software. The ability to self critique is vital when using these tools to improve.
Instead of showing the graphs overlapped, could you please show them tiled. In addition, can you post: GPS Speed, Throttle or Pedal Position and GSum?
If you don’t have GSum, the formula is: sqrt((GPS_LatAcc^2)+(GPS_LonAcc^2))
Previously, Matt posted a math channel that computes brake trace from longitudinal G: abs(IF(EQ(LT(-GPS_LonAcc,0.2),0),-GPS_LonAcc,0))
Details are shown above
in addition, go into Map and develop a track map with segments so you can look at your theoretical best lap and best segments to show you true capability. An example is shown above.
Once you have all that, pls post a new screen picture and we’ll throw our comments at it.
And part of this is hopefully sharing a simple �Basic AiM Self Coaching� or �AiM for Dummies� workflow so others can duplicate it. The nice thing is the tenets for this apply to all data systems and software. The ability to self critique is vital when using these tools to improve.
Agreed! I've heard people say the solo is just a lap timer. I don't believe that. then again, as I shared in email, me looking at the data is like me looking at those patterned pictures in the mall in the 90's. the guy working the booth can tell me if I stare long enough a 3D dinosaur will appear, but it takes some guidance to see it.
Frank - Thanks so much for your time. Here's the result and now I can see, painfully, just how much coast there is going into the corners..for turn 1 and the bus stop, there's a good 3-400 feet from Vmax to significant braking.

 06-28-2018, 08:56 PM