When you click on links to various merchants on this site and make a purchase, this can result in this site earning a commission. Affiliate programs and affiliations include, but are not limited to, the eBay Partner Network.
Hoping to hear from some dyno experts on a few questions/issues. This is going to start out simple but the entire extent of things I want to discuss might be too complex for the forum format. Anyway, I'll give it a go.
The MAHA dyno, or at least this specific graph, is very interesting.
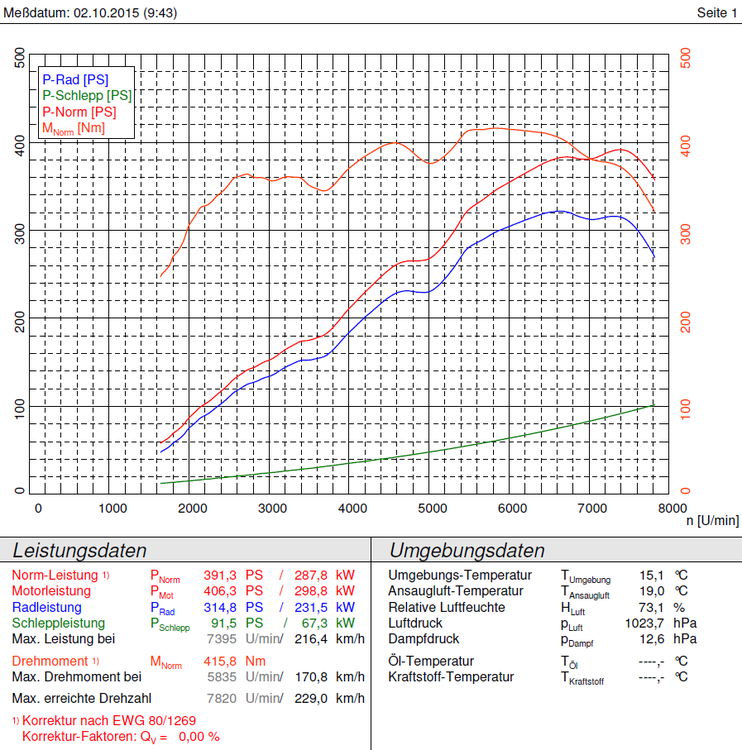
The lowest green line is the parasitic loss from the drivetrain. Since it is not possible to measure this, this is calcuated, perhaps based on a few known factors such as published HP specs, drivetrain layout, etc. Notice it increases as rpm increases, sub-exponentially (ie, more than linear). Again, seems completely reasonable.
P-Rad (blue) is the measured wheel hp, not corrected. P-Norm (red) is the calculated bhp, corrected. The correction is EEC. I believe that EEC and SAE correct for the same standard atmospheric conditions, but don't know if they do this in different ways, or what.
Notice the peak PS and the peak RPM: 391.3@7395. This agrees very, very closely with Porsche spec. So on its face this appears to be an extremely accurate dyno.
Now, because the parasitics increase with RPM, and the P-Norm slows its rate of increase before the peak (ie it's not gaussian), the parasitics start to have a magnified effect before the peak. You can see that where P-Norm takes a small dip, P-Rad takes a bigger dip; this is due to increasing loss with increased rpm. So, although the bhp peak is at 7400 rpm, because of this slope decrease, the peak power at the wheels actually occurs at a much lower rpm! approx 6600 rpm, a significant difference.
I guess I don't have a specific question here yet. Any experts want to chime in and discuss though? I'm hoping to get some kind of confirmation, that yes this is a correct phenomenon.
One more important point: the P-Rad is not corrected. AIUI, dyno correction is a constant factor, and if I apply correction to P-Rad (I'll post that later), I see that the two local maxima still retain their relationship, that the earlier local maximum is still the global maximum. This is what I would expect. Note that the non-linear parasitic loss is applied to P-Rad, so I don't think there's an error in interpretation due to the shape of P-Rad being non-linearly distorted. If correction is not a constant factor, eg if it is instead proportional to rpm, then the amount of correction would be different at the two local maxima and this would be an error in analysis. Still, even if that is the case, the uncorrected, ie actual in current atmospheric conditions, rpm at peak wheel hp does not coincide with peak bhp.
The leistungsdaten section unfortunately doesn't report this. The P-Rad peak is not actually correct. It is the P-Rad value at the P-Norm peak. Depending on the shape of P-Norm, as in this case, this doesn't show the correct whp peak value. The value of the error is smallish (6-7hp) but still big enough that we should care.
Last edited by mousecatcher; 10-26-2018 at 04:50 PM.
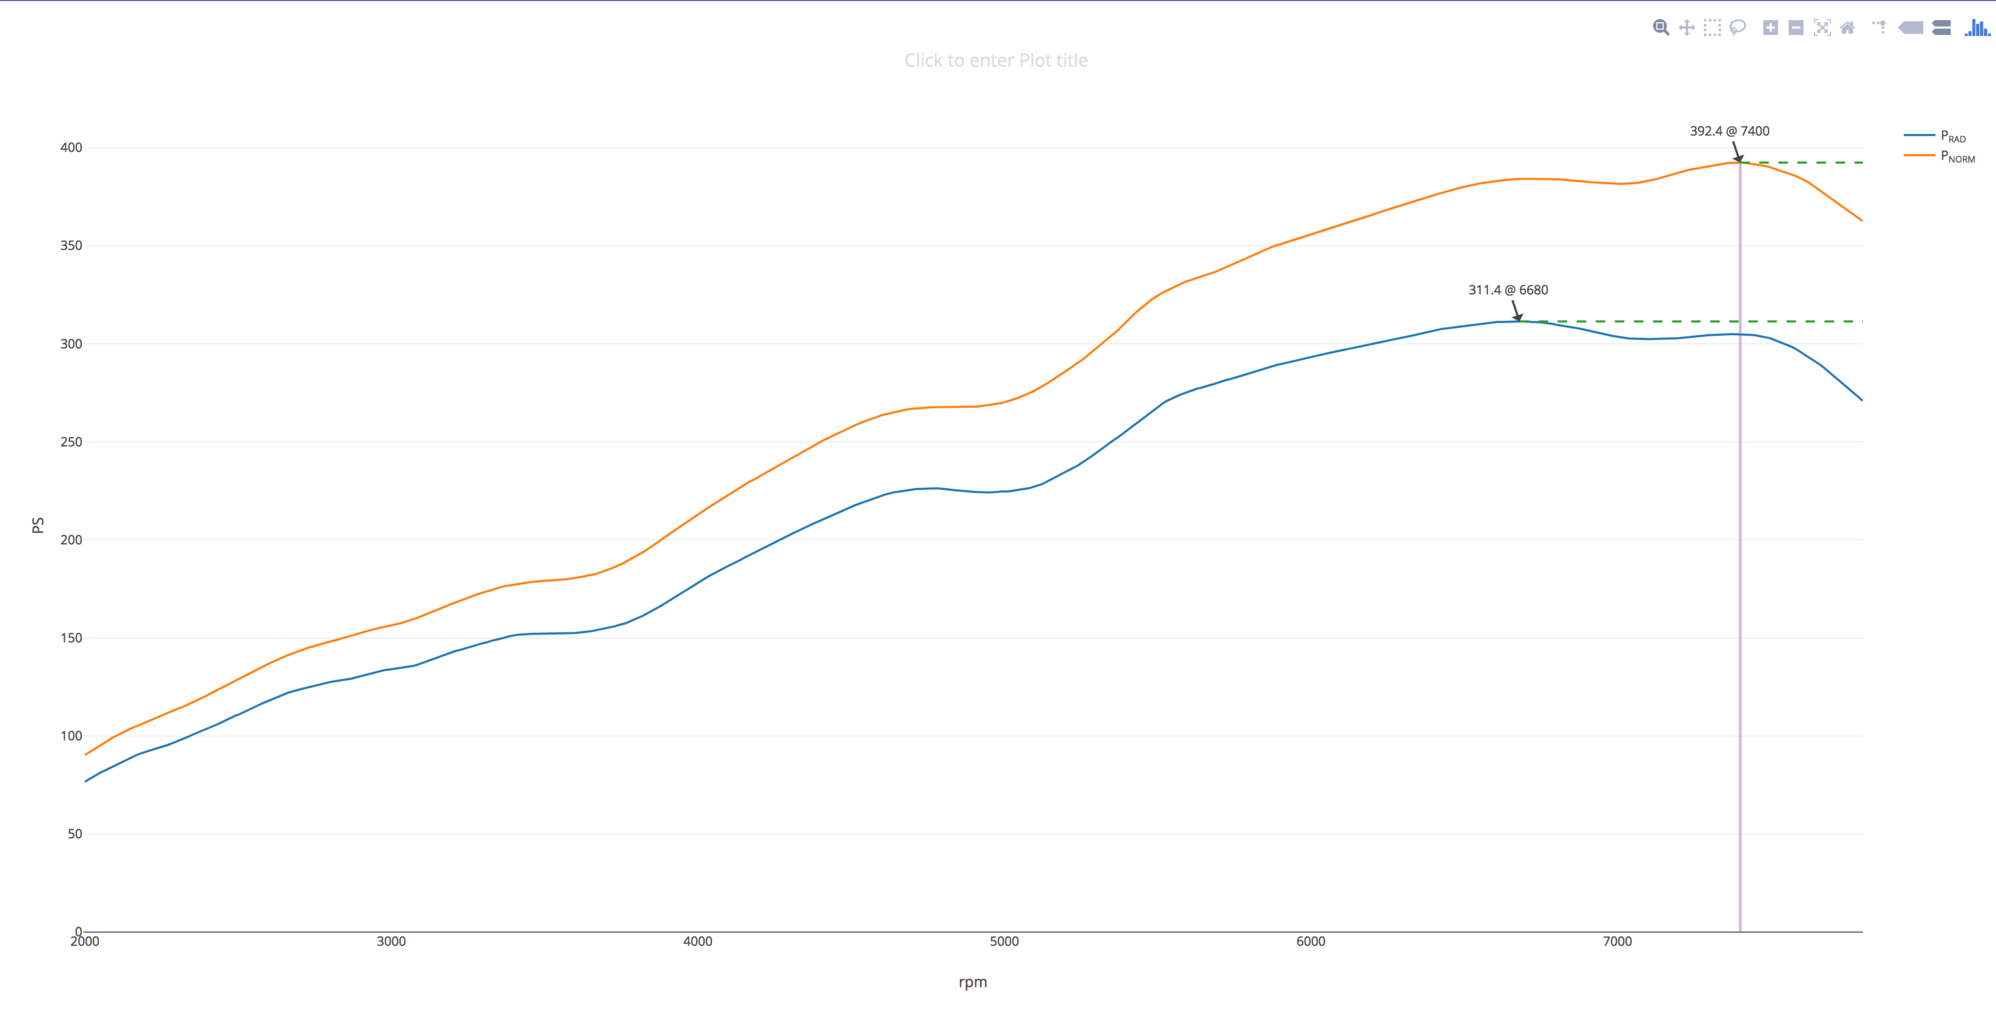
I extracted just the P-RAD and P-NORM and annotated it for clarity. The values aren't exact match to the dyno due to unavoidable digitizing error. I think this graph should illustrate my point much more clearly.
The P-RAD values in this graph have been EEC corrected. The corrected P-RAD is 304.9@7400. It makes more sense to show both lines as corrected values.
I know this is a dense subject and I haven't given it enough time for you to digest, but I believe I've found my answer (to the first part of this saga).
Looks like there is this DYNO-MAX software which can calculate the -- wait for it -- exponential parasitic curve, for any dyno. Also, Dyno Dynamics has a mode where it can calculate (create) the curve, and most notably, so does MAHA. They work by measuring the coast down time w/ vehicle on dyno vs known coast down time of the dyno itself. This is very similar to how aero drag is measured on the cheap.
So, importantly, a) the parasitic curve is measured, not heuristically determined, and b) the curve is in fact exponential as I would expect. (like aero drag would be as well)
But why would you care about crank hp? What gets the the ground is what matters at the end of the day. I didn't find any discussions online around this, but I would guess it is so you can normalize chassis dyno's to each other! If you know and can trust the manufacturer spec at the crank, you can use that in conjunction with the measured parasitic to normalize the wheel hp readings across dyno's and even for just 1 dyno you can use it to calibrate the readings. So, probably, the reason the MAHA graph above seems to agree so closely with mfgr is because it has been calibrated to it. This would seem to be a function of the software and not the dyno itself, ie as long as the dyno is competent enough to be repeatable run-to-run.
Anyway I'm getting off into the weeds. The main takeaway is that indeed the parasitic loss is exponential, is accurate, and the wheel hp can in fact be at a different rpm than the crank bhp due to this exponential factor and the shape of a given hp curve.
Anyone care to chime in before I get to ... phase 2?
Variations in horsepower loss vary due to different tires, different pressures, different vehicle weights, and even different methods of strapping down the car - that's why I have heard everything from 10% to 35% for estimated power losses "in the drivetrain" on a chassis dyno. I put the drivetrain in parenthesis, because this loss isn't all coming from the drivetrain, some of it (again, it's variable) is being contributed by the dyno and the tire/roller interface. Do you think an auto manufacturer would really accept a 35% power loss from their drivetrain engineers? Some dynos say they can measure your drivetrain loss by doing a coastdown test. They tell you to get the vehicle up to a certain speed. pop the car in neutral, and let it coast down - they measure the time to decelerate, and this is supposed to be the drivetrain loss. Think about this: Under acceleration, the gears are smashed hard against each other, the bearings are being side loaded, the pinion is trying to unscrew itself out of the rear-end, etc. During the "coast down test" everything is unloaded and freewheeling as it decelerates and he gears are being driven on the opposite sides of the teeth - the car is now being driven by the wheels and there is no load at the input shaft of the transmission. The frictional loads and losses are not the same as during hard acceleration. If the loads aren't the same, then what good is the test. Sure, you've got data, but it's worthless.
Of course this is a sales pitch for dynapack, but it does have merit. I was actually already thinking that the LSD loading will be different in decel then accel. So yeah, coastdown parasitic loss measurement won't be perfect, but it will help you (e.g.) isolate the difference between tire losses in each session due to strapping the car down tighter or looser.
Apparently dynapack is repeatable to within 0.3% ... wow. OTOH it is hard to argue with the MAHA dyno result shown above that is spot on with manufacturer spec. I think I'm more confused now.
MAHA does it right. Many manufacturers including Porsche use MAHA equipment in their factories for testing and verification. It is true that a coastdown loss measurement is in itself imperfect but somehow MAHA software has a very good algorithm to calculate these things indirectly probably via some constants that have been set depending on the particular type of drivetrain.
Wheel power measurements are generally inferior in terms of their information value because they can be fudged by a large number of factors. Different wheels, tires, tire pressure, the preload on the straps to hold the car in place or even simply the gear you dyno in all lead to big swings in measured horsepower. As such it is a pretty useless value that you cannot even compare to other dynos of the same type.
You can't fool a MAHA the same way, it will always somehow magically spit out the same crank number and you can drive to another one a hundred miles away and get the same number.
If you are just tuning or comparing mods on the same car on the same dyno and do your best to elimimtate the other variables then any dyno will do. If you want a repeatable number that you can actually compare to rated power by OEM or other people online then you need a MAHA.
So would you say that even dynapack isn't as accurate as MAHA? (note: accuracy vs repeatability; I understand that dynapack is VERY repeatable but don't know about the accuracy)
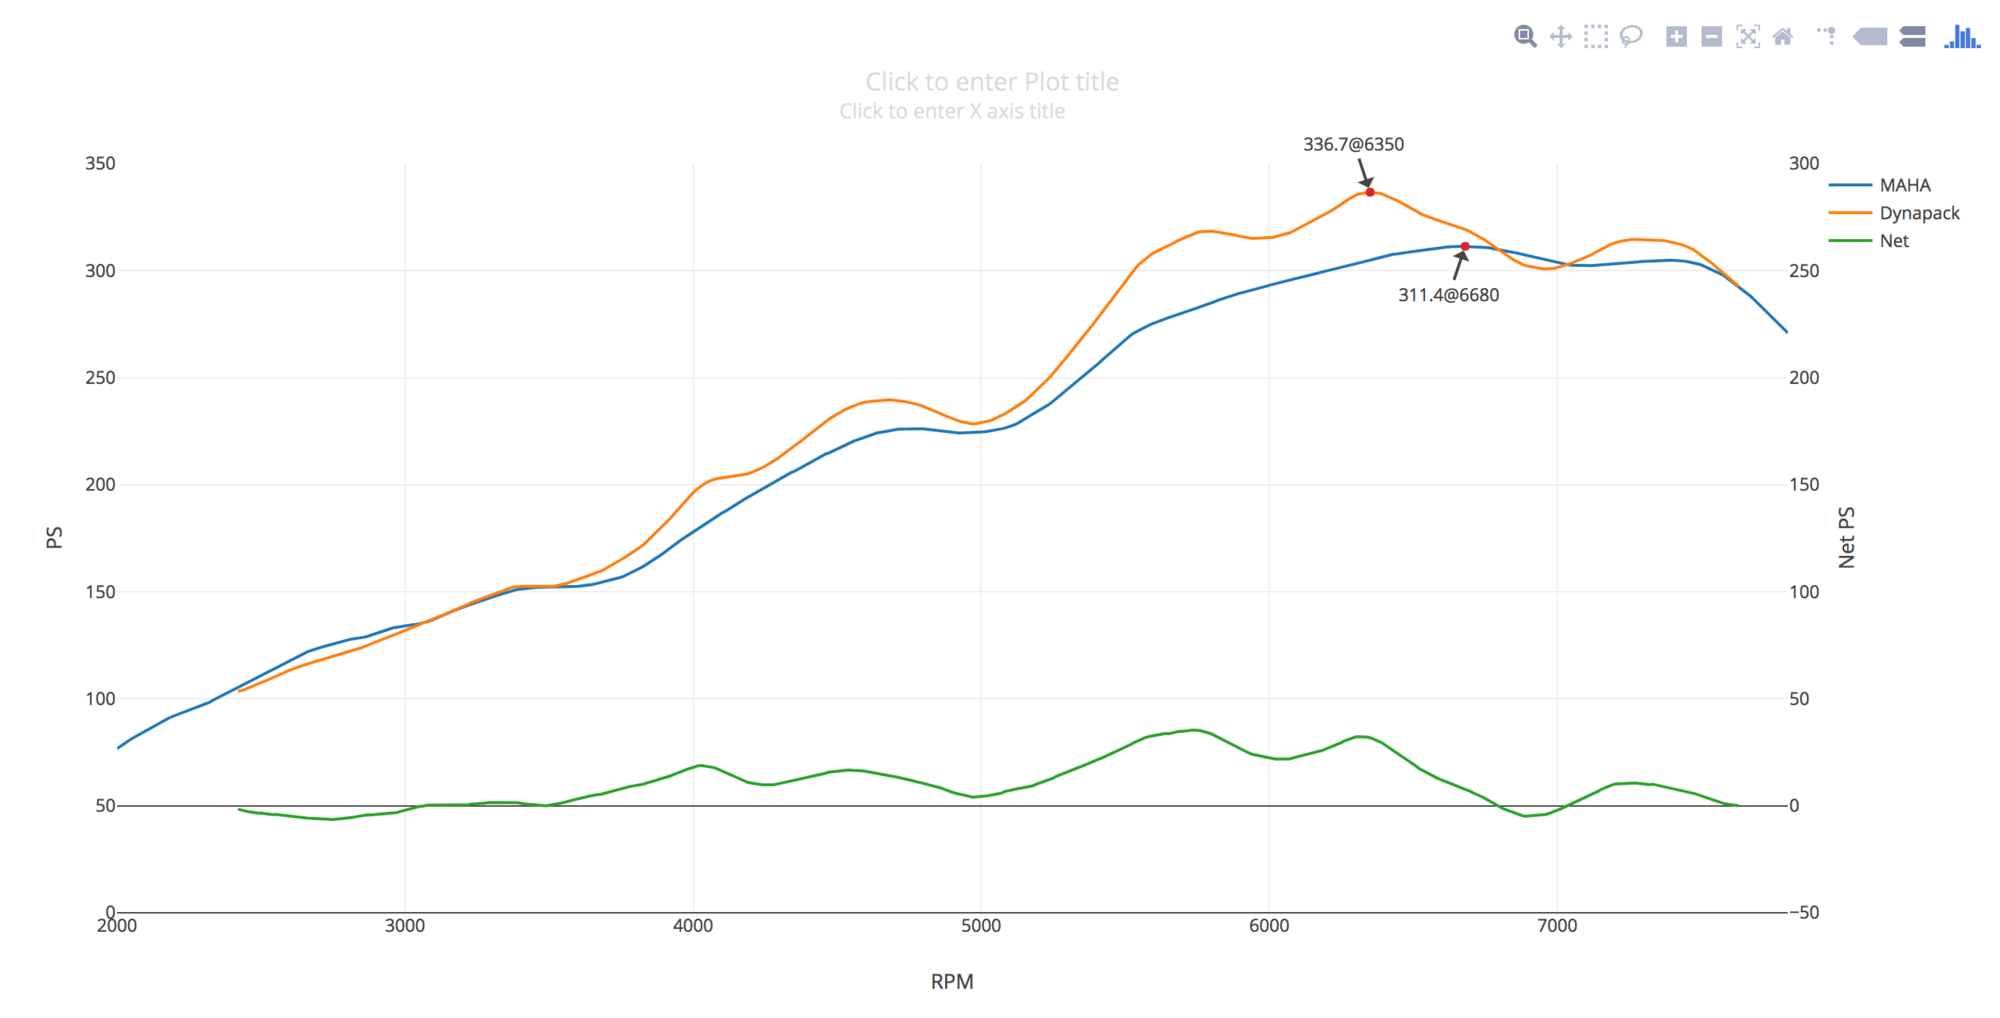
Here are 2 OEM pulls. Dynapack vs MAHA. I'm not concerned about the HP difference per se -- the Dynapack should read higher as there is no wheel/tire loading. I'm concerned about the different shape.
The MAHA wheel power graph shows the peak at the wheels is at lower rpm than crank HP. OK, based on your endorsement of MAHA let's take that as truth. It's a 700rpm difference. This is due to drivetrain losses that increase exponentially. At the top of the rpm range, the crank HP increases more slowly than the parasitic losses, effectively driving wheel HP peak downwards.
The dynapack hub power graph shows the peak at the hub is another 350rpm lower. I suppose this is understandable for the same reason -- the tire itself has exponential parasitic loss, so the peak at the hub should be lower.
But if dynapack is accurate, shouldn't the shape of the curve follow the shape of the MAHA curve? Shifted to lower rpm due to exponential parasitics, but still generally following the shape. Up to about 5550 it does. But there's an extra dips at 4300 and 6000, and the dip at 5000 and 6900 are overly pronounced. At 6900 the dynapack even dips below MAHA, which doesn't seem like it should happen.
Besides that particular behavior at 6900 rpm, in general, the dynapack graph is very lumpy compared to MAHA. This is concerning because many header+tune charts are showing some removal or even elimination of this lumpiness in certain rpm ranges. If the lumpiness is real, why isn't it on the MAHA? If the lumpiness is just a dyno artifact, how is it some header/tunes smooth it out?
Again, I'll leave it here for now, but I have one more follow-up question.
So would you say that even dynapack isn't as accurate as MAHA? (note: accuracy vs repeatability; I understand that dynapack is VERY repeatable but don't know about the accuracy)
Here are 2 OEM pulls. Dynapack vs MAHA. I'm not concerned about the HP difference per se -- the Dynapack should read higher as there is no wheel/tire loading. I'm concerned about the different shape.
The MAHA wheel power graph shows the peak at the wheels is at lower rpm than crank HP. OK, based on your endorsement of MAHA let's take that as truth. It's a 700rpm difference. This is due to drivetrain losses that increase exponentially. At the top of the rpm range, the crank HP increases more slowly than the parasitic losses, effectively driving wheel HP peak downwards.
The dynapack hub power graph shows the peak at the hub is another 350rpm lower. I suppose this is understandable for the same reason -- the tire itself has exponential parasitic loss, so the peak at the hub should be lower.
But if dynapack is accurate, shouldn't the shape of the curve follow the shape of the MAHA curve? Shifted to lower rpm due to exponential parasitics, but still generally following the shape. Up to about 5550 it does. But there's an extra dips at 4300 and 6000, and the dip at 5000 and 6900 are overly pronounced. At 6900 the dynapack even dips below MAHA, which doesn't seem like it should happen.
Besides that particular behavior at 6900 rpm, in general, the dynapack graph is very lumpy compared to MAHA. This is concerning because many header+tune charts are showing some removal or even elimination of this lumpiness in certain rpm ranges. If the lumpiness is real, why isn't it on the MAHA? If the lumpiness is just a dyno artifact, how is it some header/tunes smooth it out?
Again, I'll leave it here for now, but I have one more follow-up question.
Interesting results. I've noticed the dynapack dynos are often "lumpier" and have more swings in the torque curve than most other dyno charts. I don't know near as much on the dyno topic as you guys but assume that's because even the Maha is still a roller driven dyno so the momentum of the roller smoothes the torque curve vs the dynopack which has no such large rotating mass being bolted to the wheels?
So would you say that even dynapack isn't as accurate as MAHA?
I don't know but it is always going to depend on what you want to measure precisely. The Dynapack has no way of measuring the transmission losses, but its software includes a fudge factor option for the user to apply if he wishes (a straight up fixed percentage) or not if you want the "raw" results which are neither wheel power nor an accurate crank power estimation. It's very specific but doesn't tell us much - if comparing to the same car on the same dyno then accuracy becomes a moot point as any dyno would do the trick.
I'm not concerned about the HP difference per se -- the Dynapack should read higher as there is no wheel/tire loading.
It should not necessarily read higher, you can move the Prad curve up and down on a MAHA by choosing a different gear or increasing/decreasing the load which influences the friction losses between the tires and rollers quite a bit. Prad on a MAHA is not meant to be compared to wheel power measurements of other dynos. It's an internal number that can be ignored for most intents and purposes.
I'm concerned about the different shape.
I think there are too many variables to draw conclusions between two machines in two different places with unknown cooling and atmospheric conditions on top of the different type of load that is placed on the engine and drivetrain. As mentioned by the poster above me the rotating mass on a MAHA is very considerable which will automatically smooth the curve more than the hydraulic pressure reading of a Dynapack.
The MAHA wheel power graph shows the peak at the wheels is at lower rpm than crank HP. OK, based on your endorsement of MAHA let's take that as truth. It's a 700rpm difference. This is due to drivetrain losses that increase exponentially. At the top of the rpm range, the crank HP increases more slowly than the parasitic losses, effectively driving wheel HP peak downwards.
Obviously this phenomenon will depend on the power curve of the engine but for NA Porsche engines it seems to hold true generally. At high roller speeds most of the parasitic loss is tire friction (which does tend to go parabolic as you've noted) so the higher gear you dyno in the bigger the absolute delta in tire speed between peak wheel power and peak flywheel power. Which due to the non-linear increase in drag means you will see a different rpm "gap" between peak tire and flywheel power depending on the gear you're in.
But if dynapack is accurate, shouldn't the shape of the curve follow the shape of the MAHA curve? Shifted to lower rpm due to exponential parasitics, but still generally following the shape. Up to about 5550 it does. But there's an extra dips at 4300 and 6000, and the dip at 5000 and 6900 are overly pronounced. At 6900 the dynapack even dips below MAHA, which doesn't seem like it should happen.
Probably, if you can control the conditions perfectly and manage to place the same kind of load on the engine and then apply some smoothing they shouldn't be a million miles apart. In theory and if the premise holds. For most shops that install a dyno absolute accuracy isn't very high on the list of priorities I'm guessing. Probably, as with anything, you kind of get what you pay for. MAHAs are naturally more popular in Europe because they are very good at spitting out numbers that are directly comparable to the car manufacturer's quoted numbers. Which leads to a bit less of the "brand X seriously underrates power on its new XXX" bullsh!t. Though you can get 'incorrect" results on a MAHA too if you don't understand how it or the car you're strapping onto it works. For example, pretty much every modern turbocharged car is correcting its power output to the atmospheric conditions. So if you strap, say, an M3 or a 911 Turbo onto a dyno in warm weather and apply the normal corrections it will appear to be making a lot more than rated power. Remove the CF in the dyno and suddenly they will be making exactly what they should. Etc.
So here's where I was ultimately trying to go. Thanks for getting me here. I think I know the answer already but let's continue.
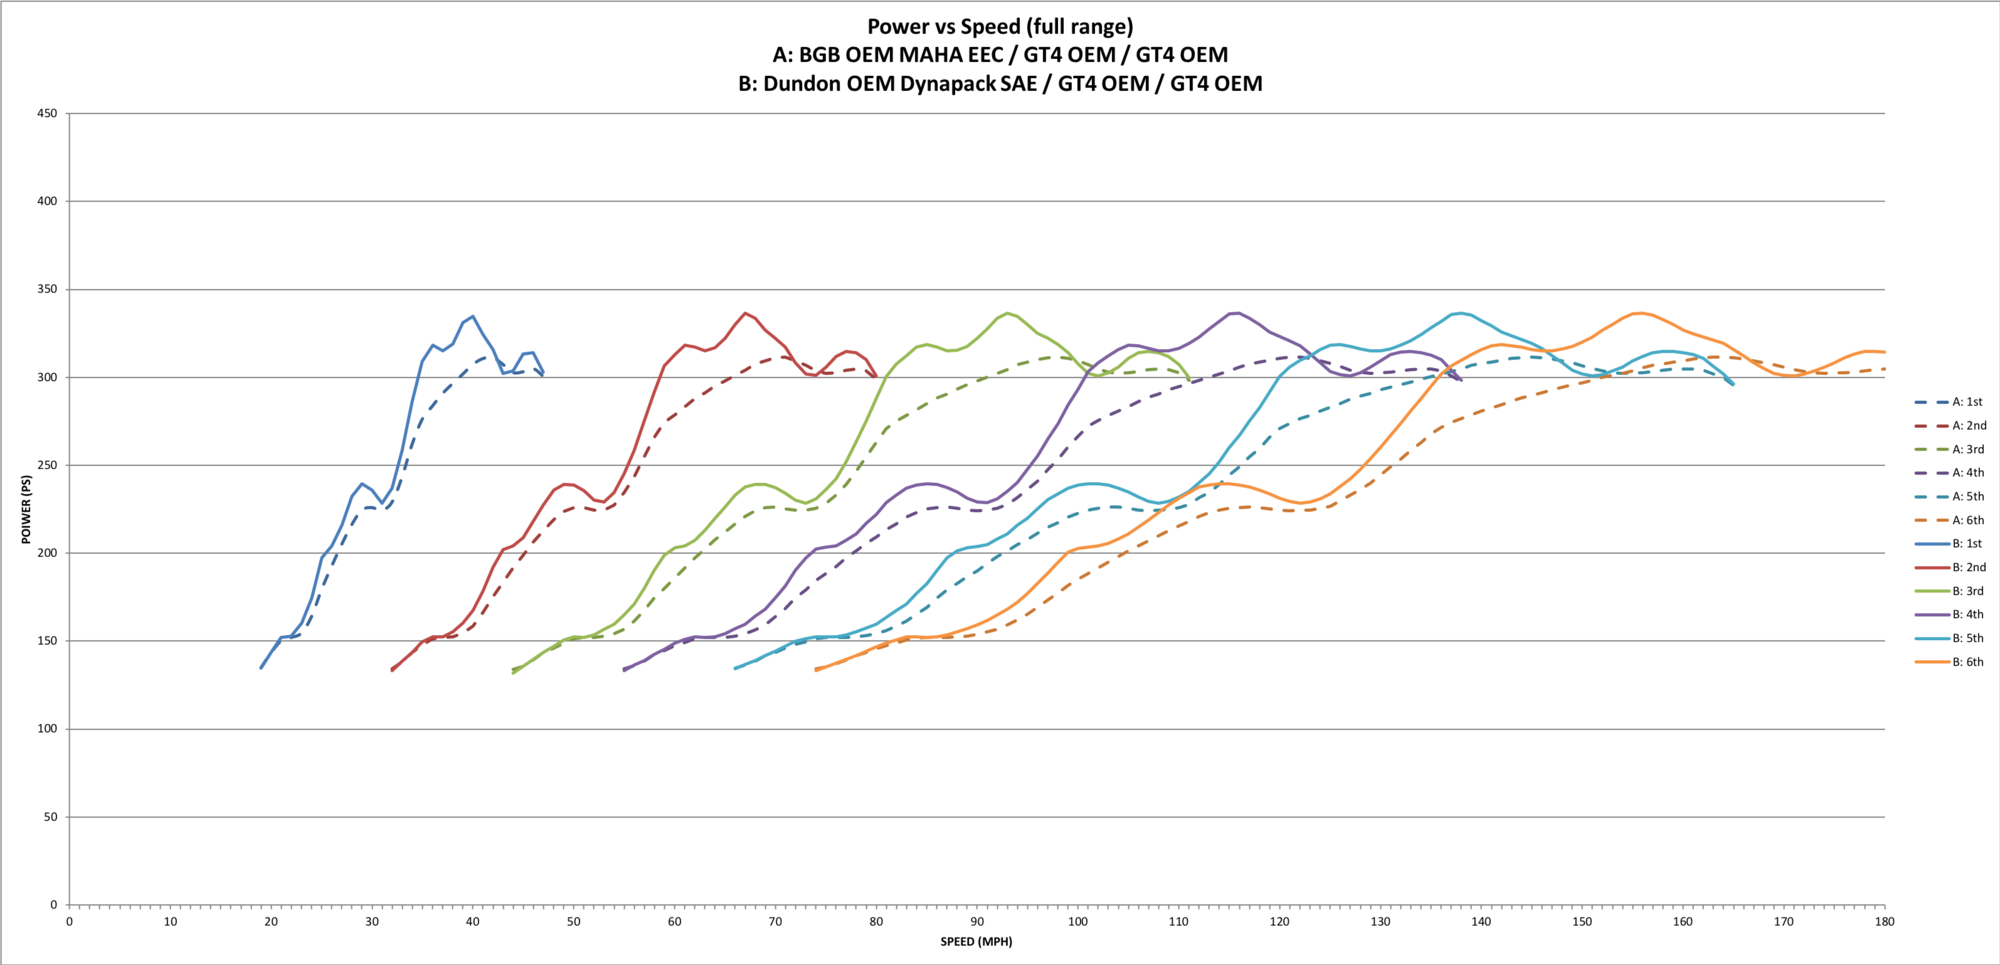
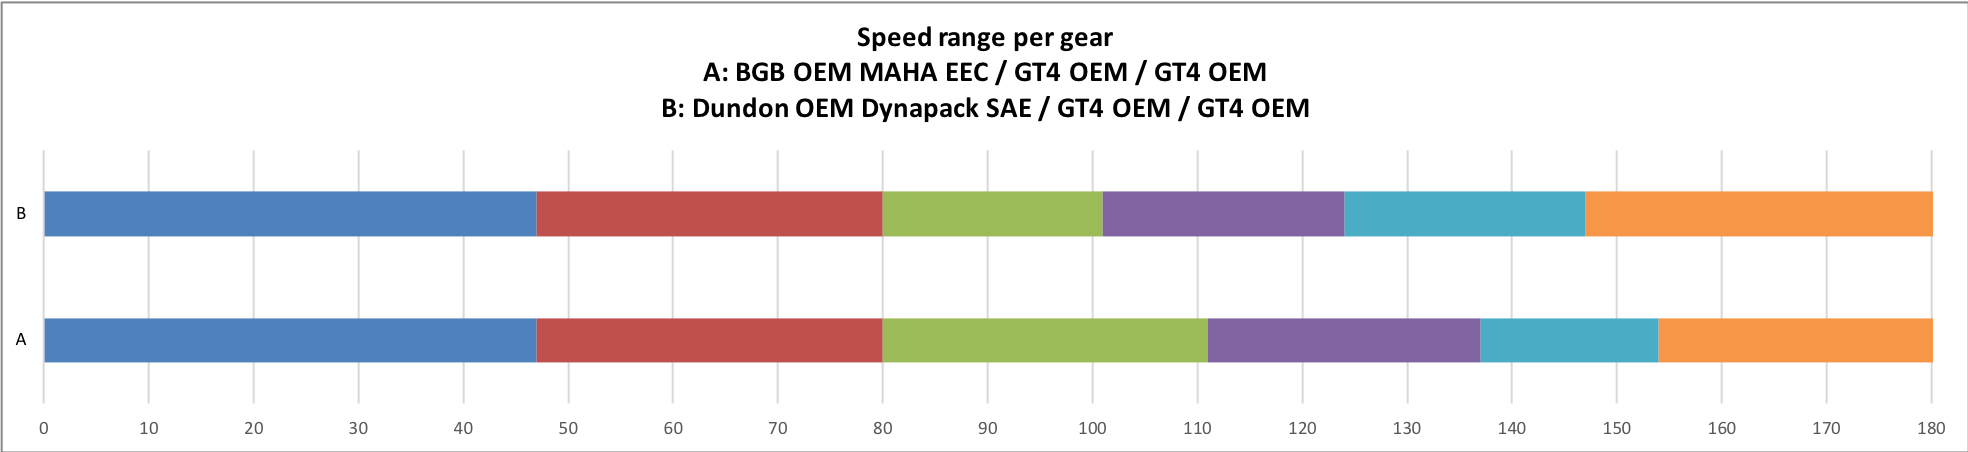
In another thread (AQ final drive), Mech33 pointed out that shift point is determined by power. Clearly you shift so that area under the power curve is maximized. (Note that one shift point might be a bigger drop than another, but the average power to the next shift point is what you maximize. Just as you give up entry speed to make the exit longer.)
Here is a power comparison using the MAHA vs Dynapack graphs -- note again, both are OEM configuration graphs. If you were to use these to decide shift point, you can see the vast difference between these 2.
From 1-2 and 2-3 there's no difference -- both shift at redline. From there they diverge. Here is a chart capturing the difference.
While both dyno graphs may be correct from the POV of the conditions under which they were generated, if you used them as the basis for determining shift point you'd get very very different answers. How to know which, if either, of these is the more correct graph -- which one is more closely emulating real world conditions?
Now if I may just babble on,
I think the answer is that you need to capture real world acceleration data. This can be a simple OBD logger for rpm-vs-time during a 1/4mile run. Then bring that data into the dyno somehow and have it control the acceleration/sweep rate to match the capture. I guess a pure inertia roller dyno can't do this. And of course you only dyno in one gear whereas the acceleration rate will change per gear, as both aero and tire loading exponential effects start to dominate at higher speeds. So even then, you don't have a complete picture.
This is what K&C machines do. At the highest levels of competition you play back real track data into the K&C and you can tune the suspension for a particular track.
Do any dynos do this? EDIT: mustang dyno's apparently have this feature. Which tells me that my reasoning is sound.
Does anyone have Harry's, Cobb or other in-car HP graphs to share? I think that would be revealing.
Last edited by mousecatcher; 10-31-2018 at 06:07 PM.
 10-26-2018, 01:29 PM