Notices

AIM Data question

Thread Tools
 
Search this Thread
 
Old Apr 7, 2015 | 10:51 PM
  #1  
CharleyH's Avatar
CharleyH
Thread Starter
Rennlist Member
10 Year Member
 
Joined: Dec 2014
Posts: 407
Likes: 10
Default AIM Data question

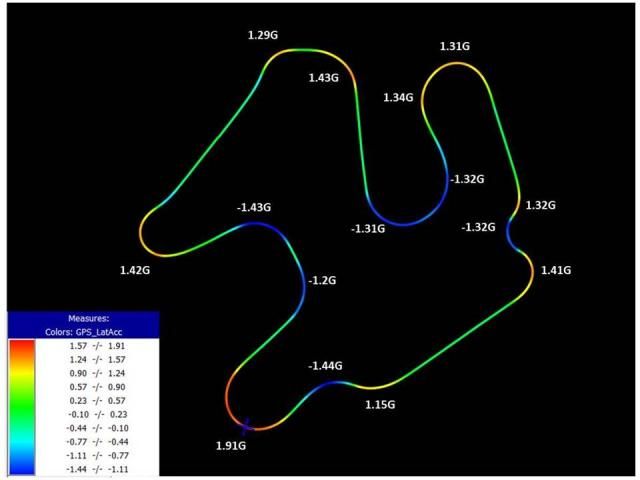
Is there a way to make labels appear on the AIM color maps like show below? I did this using Powerpoint so that I could visually see where I could push the car more. Ideally I would like to have the G's and Speed show up in each corner, so I don't have to do it manually.

Thanks for the help,
Charley

Reply
Old Apr 7, 2015 | 11:12 PM
  #2  
Matt Romanowski's Avatar
Matt Romanowski
Rennlist Hoonigan
which cost no drachmas
Lifetime Rennlist
Member


Rennlist
Site Sponsor
20 Year Member
 
Joined: Dec 2001
Posts: 12,997
Likes: 1,195
From: Manchester, NH
Default

That is the GPS map and you can't do it there. Go View > Track Report. Then on the top right click settings and select to show the min/max.
Reply
Old Apr 8, 2015 | 12:51 AM
  #3  
CharleyH's Avatar
CharleyH
Thread Starter
Rennlist Member
10 Year Member
 
Joined: Dec 2014
Posts: 407
Likes: 10
Default

Thanks Matt. I took a quick look at the area you recommended and there are a ton of markers. Is there a way to narrow them down?

Thanks for the help,
Charley
Reply
Old Apr 8, 2015 | 02:30 AM
  #4  
Spyerx's Avatar
Spyerx
Rennlist Member
10 Year Member
 
Joined: Mar 2012
Posts: 17,239
Likes: 2,206
From: SoCal
Default

This might be easier to see if you use an absolute value of lateral acceleration, so the number is always positive. Math channel can do this...

If not:
Open a test
View menu - track report
Click settings for the track report - top right corner
Select the value you want to plot, uncheck show max and min click apply & exit. This will give you the banding.
Select measures tap on the left of screen
make sure you can see the little blue up and red down arrows next to the measures
Click the up and/or down arrow of the measure you want to show (lat g and speed)

I think if you select max Gs, and the min/max speed you'll get close, maybe not perfect.

Example:

Reply
Old Apr 8, 2015 | 02:32 AM
  #5  
Spyerx's Avatar
Spyerx
Rennlist Member
10 Year Member
 
Joined: Mar 2012
Posts: 17,239
Likes: 2,206
From: SoCal
Default

This is just using absolute value of Gs:

Reply
Old Apr 8, 2015 | 09:59 AM
  #6  
CharleyH's Avatar
CharleyH
Thread Starter
Rennlist Member
10 Year Member
 
Joined: Dec 2014
Posts: 407
Likes: 10
Default

Thank you. I will give it a try. This looks perfect.

Charley
Reply
Old Apr 9, 2015 | 12:42 AM
  #7  
CharleyH's Avatar
CharleyH
Thread Starter
Rennlist Member
10 Year Member
 
Joined: Dec 2014
Posts: 407
Likes: 10
Default

Thanks for the help! I tried it and it works great. One more question, is there a way to add measurement points? Some corners don't have data.

Charley
Reply

Trending Topics

Old Apr 9, 2015 | 02:11 AM
  #8  
Spyerx's Avatar
Spyerx
Rennlist Member
10 Year Member
 
Joined: Mar 2012
Posts: 17,239
Likes: 2,206
From: SoCal
Default

Originally Posted by CharleyH
Thanks for the help! I tried it and it works great. One more question, is there a way to add measurement points? Some corners don't have data.

Charley
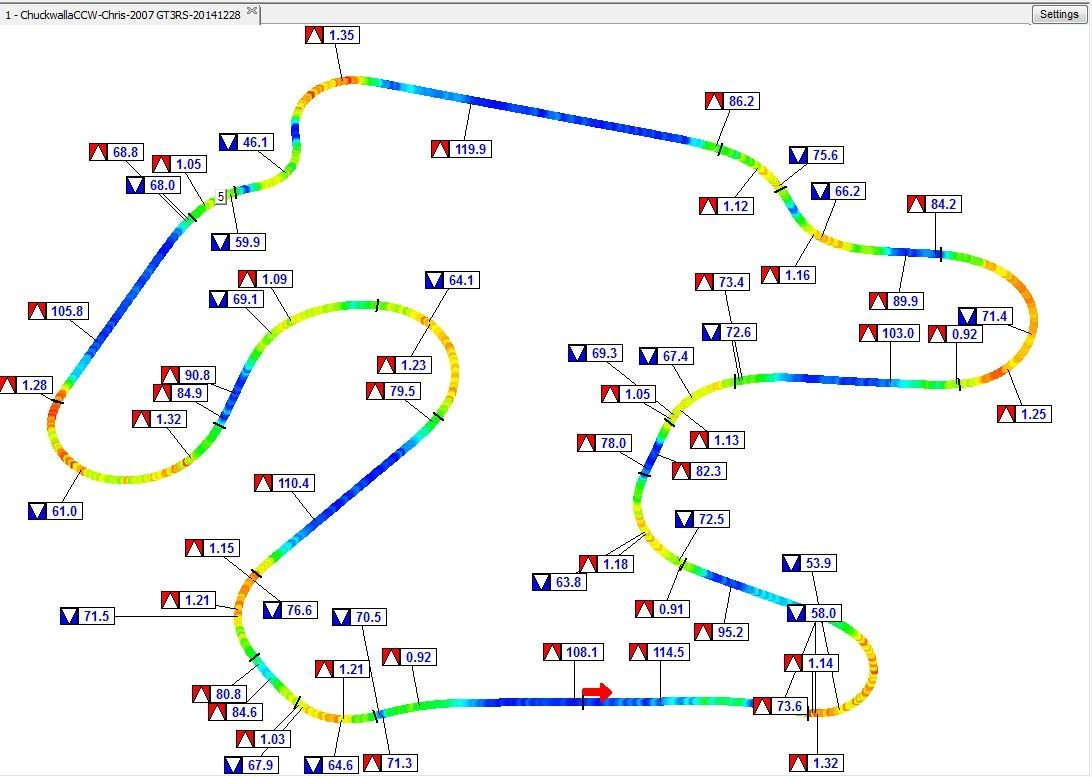
not that I know of, can you repost your graphic? By the way, you're hauling in the bowl at chuckwalla. What are you driving?
Was that CW or CCW? My graph was CCW, which i prefer there. Lots of learning on my part, but really like this track for practicing throttle steer.

Last edited by Spyerx; Apr 9, 2015 at 11:30 AM.
Reply
Old Apr 9, 2015 | 05:13 PM
  #9  
Caddell's Avatar
Caddell
Instructor
 
Joined: Dec 2006
Posts: 143
Likes: 0
From: Graham, WA
Default

Originally Posted by CharleyH
Thanks for the help! I tried it and it works great. One more question, is there a way to add measurement points? Some corners don't have data.

Charley
The actual segments in the Track Report function are based on the segments of the active track map. If you want different segments in the report, simply build a new track map (Map=>New) with the segments where you want them and when you save it your Track Report will be re-calculated with the new segments.
Reply
Old Apr 9, 2015 | 10:36 PM
  #10  
CharleyH's Avatar
CharleyH
Thread Starter
Rennlist Member
10 Year Member
 
Joined: Dec 2014
Posts: 407
Likes: 10
Default

Thanks Roger I will give that a try. Here is my current map. For some reason I am not getting markers for left hand turns.

Charley

Reply
Old Apr 9, 2015 | 11:00 PM
  #11  
Matt Romanowski's Avatar
Matt Romanowski
Rennlist Hoonigan
which cost no drachmas
Lifetime Rennlist
Member


Rennlist
Site Sponsor
20 Year Member
 
Joined: Dec 2001
Posts: 12,997
Likes: 1,195
From: Manchester, NH
Default

Originally Posted by Caddell
The actual segments in the Track Report function are based on the segments of the active track map. If you want different segments in the report, simply build a new track map (Map=>New) with the segments where you want them and when you save it your Track Report will be re-calculated with the new segments.
Cool info. I didn't realize that is where the channel tag locations came from.
Reply
Old May 1, 2017 | 10:58 PM
  #12  
CharleyH's Avatar
CharleyH
Thread Starter
Rennlist Member
10 Year Member
 
Joined: Dec 2014
Posts: 407
Likes: 10
Default

I am trying to make a track map again, but the option isn't available.... what am I doing wrong?
Reply
Old May 1, 2017 | 11:20 PM
  #13  
Matt Romanowski's Avatar
Matt Romanowski
Rennlist Hoonigan
which cost no drachmas
Lifetime Rennlist
Member


Rennlist
Site Sponsor
20 Year Member
 
Joined: Dec 2001
Posts: 12,997
Likes: 1,195
From: Manchester, NH
Default

Do you have a map assigned to the data? Go to Map and then view. If view is grayed out, then go Map, Manager and assign or create a map for the data you are looking at. Then you should be able to do the track report.
Reply
Old May 2, 2017 | 12:05 AM
  #14  
CharleyH's Avatar
CharleyH
Thread Starter
Rennlist Member
10 Year Member
 
Joined: Dec 2014
Posts: 407
Likes: 10
Default

Never mind, I figured out that I had to make a new map....
Reply
Old May 2, 2017 | 12:05 AM
  #15  
CharleyH's Avatar
CharleyH
Thread Starter
Rennlist Member
10 Year Member
 
Joined: Dec 2014
Posts: 407
Likes: 10
Default

Originally Posted by Matt Romanowski
Do you have a map assigned to the data? Go to Map and then view. If view is grayed out, then go Map, Manager and assign or create a map for the data you are looking at. Then you should be able to do the track report.
Thanks Matt, that was it. Thank you for the help!

Charley
Reply


All times are GMT -3. The time now is 11:22 PM.