Notices

GSum Views

Thread Tools
 
Search this Thread
 
Old 10-12-2021, 09:51 PM
  #1  
Matt Romanowski
Rennlist Hoonigan
which cost no drachmas
Lifetime Rennlist
Member


Rennlist
Site Sponsor
Thread Starter
 
Matt Romanowski's Avatar
 
Join Date: Dec 2001
Location: Manchester, NH
Posts: 12,640
Received 967 Likes on 581 Posts
Default GSum Views

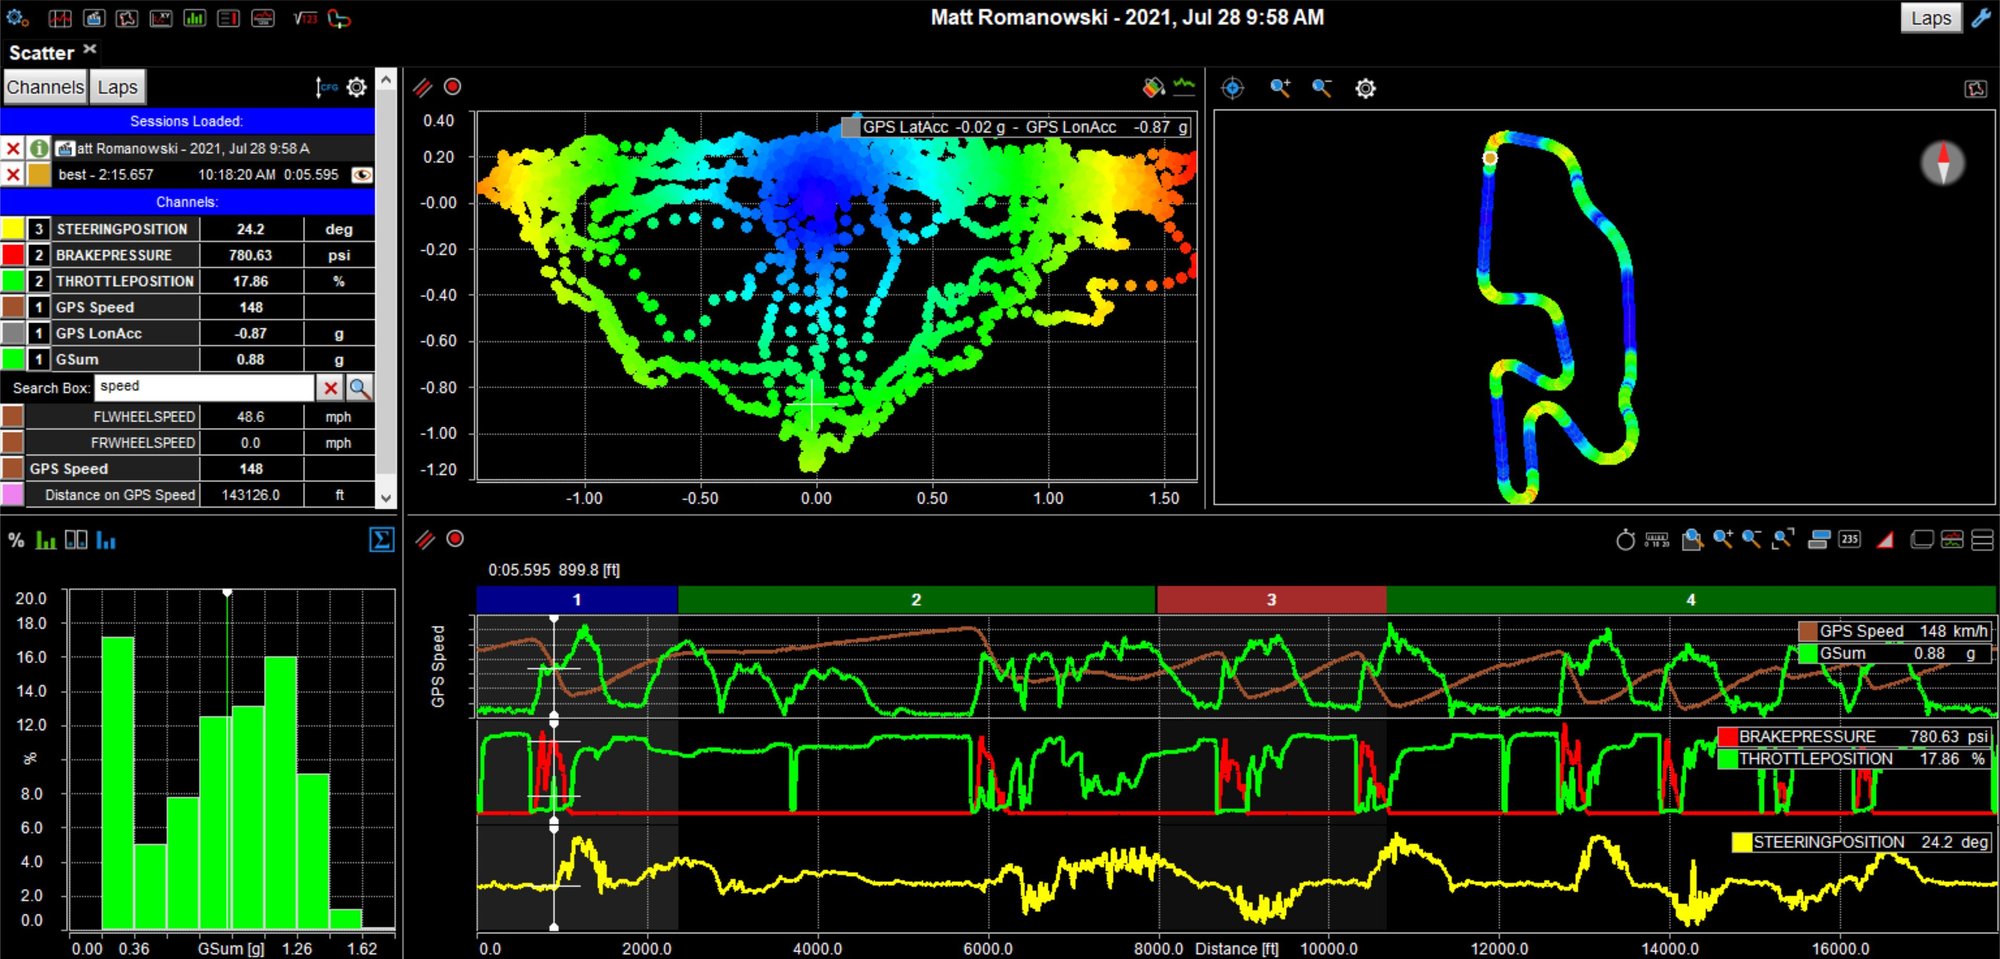
Someone on FB asked about knowing where on track when looking at a Friction Circle XY Graph. I put together this quick profile using RS3A beta to show how the point in the XY plot matches a point on the track. You can color the XY plot with any measure you want (I used Gsum) and color the track map with a channel (Gsum again). A powerful feature of the layout is to then put a measures graph underneath with speed, throttle position, brake, and steering to see how the driver inputs all combine to build G forces and create the GSum Graph. The histogram bottom left is a great way to see where most of the G forces are distributed.


RS3A provides a great way to look at the friction circle while showing the track position.


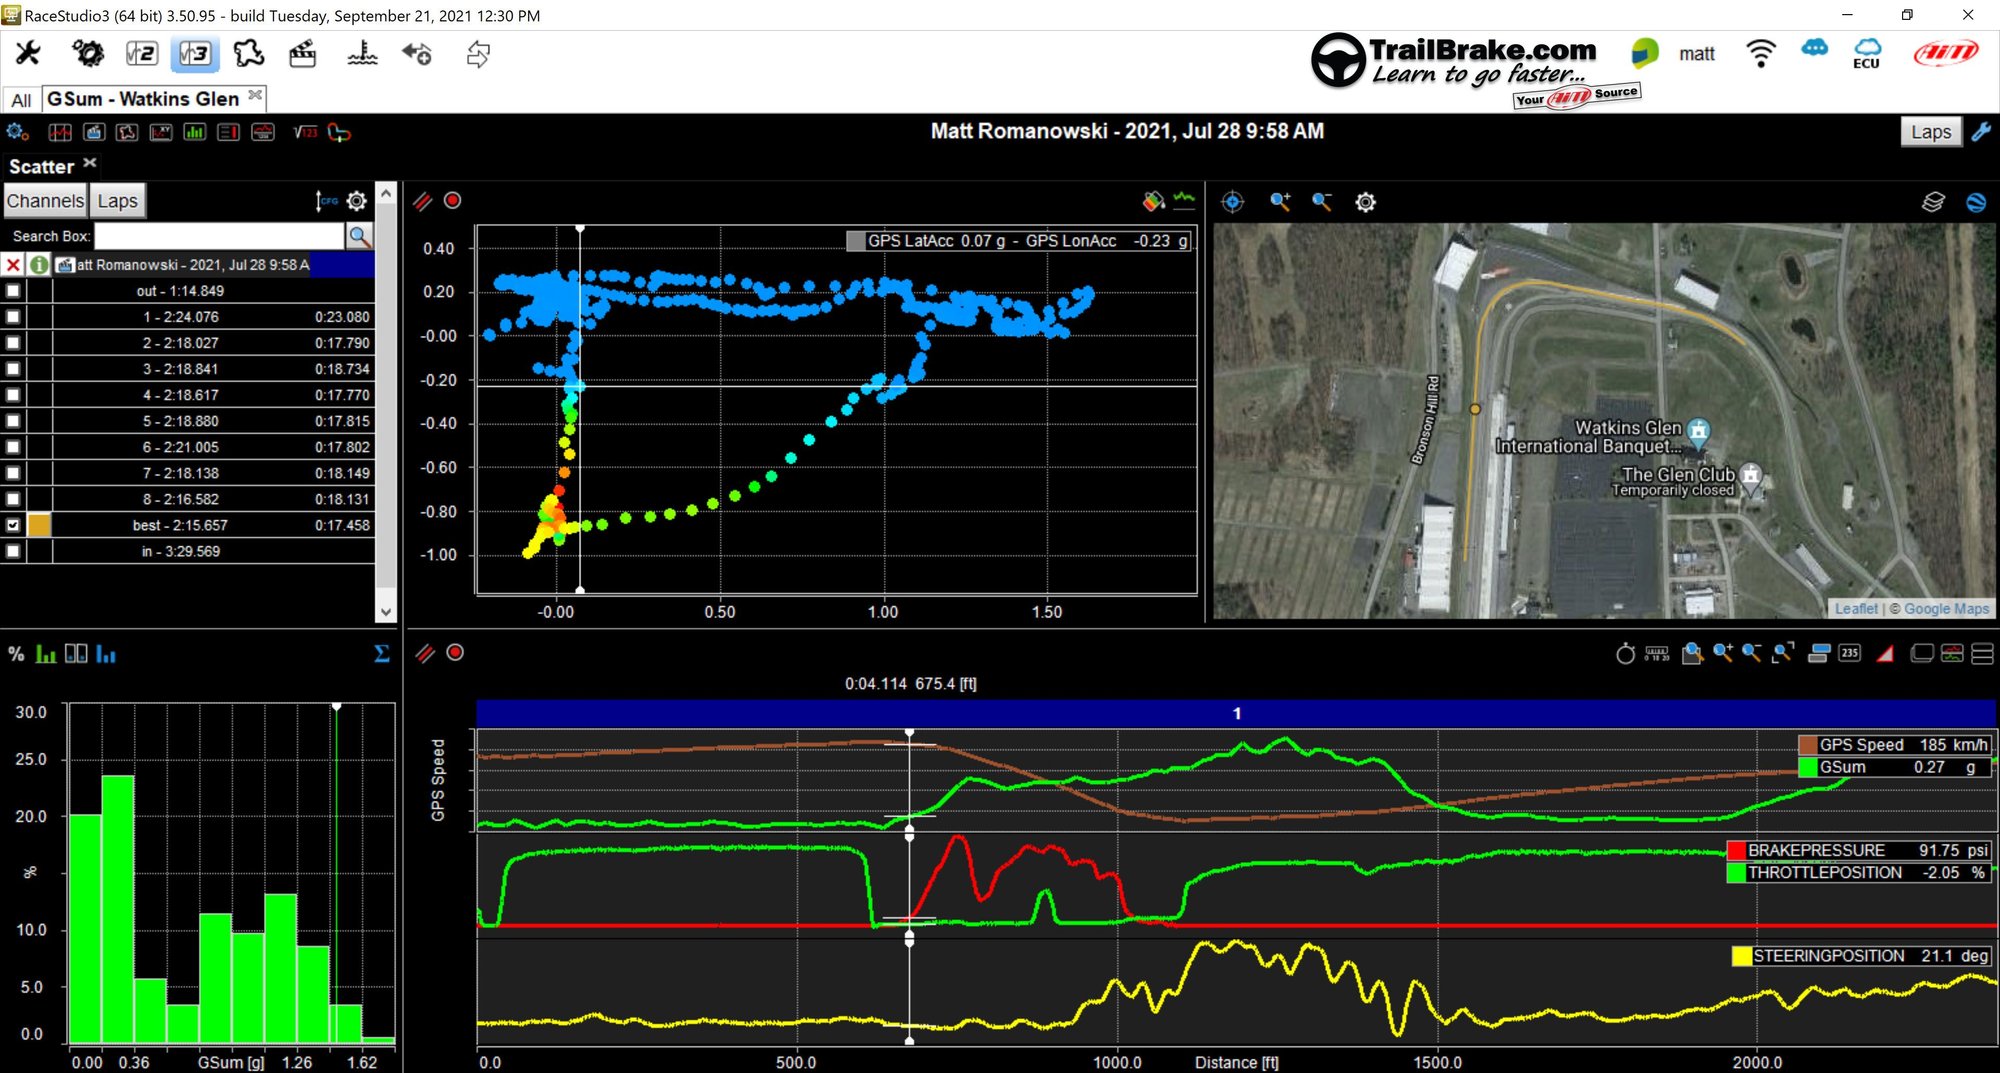
For those that are really into data, you'll know that the coloring of Gsum XY plot is really just the distance from the center. You can color that graph with something like brake pressure, throttle position, etc. to see even more info. The graph below is zoomed into turn 1 and the Friction Circle Graph is now colored by brake pressure.


Zoomed into T1, you can see the Friction Circle colored for brake pressure with all the drive inputs in the Measures Graph at the bottom.
The following users liked this post:
ShakeNBake (10-15-2021)
Old 10-13-2021, 11:53 PM
  #2  
boxer-11
Rennlist Member
 
boxer-11's Avatar
 
Join Date: Sep 2013
Location: Olympia, WA
Posts: 451
Received 54 Likes on 37 Posts
Default

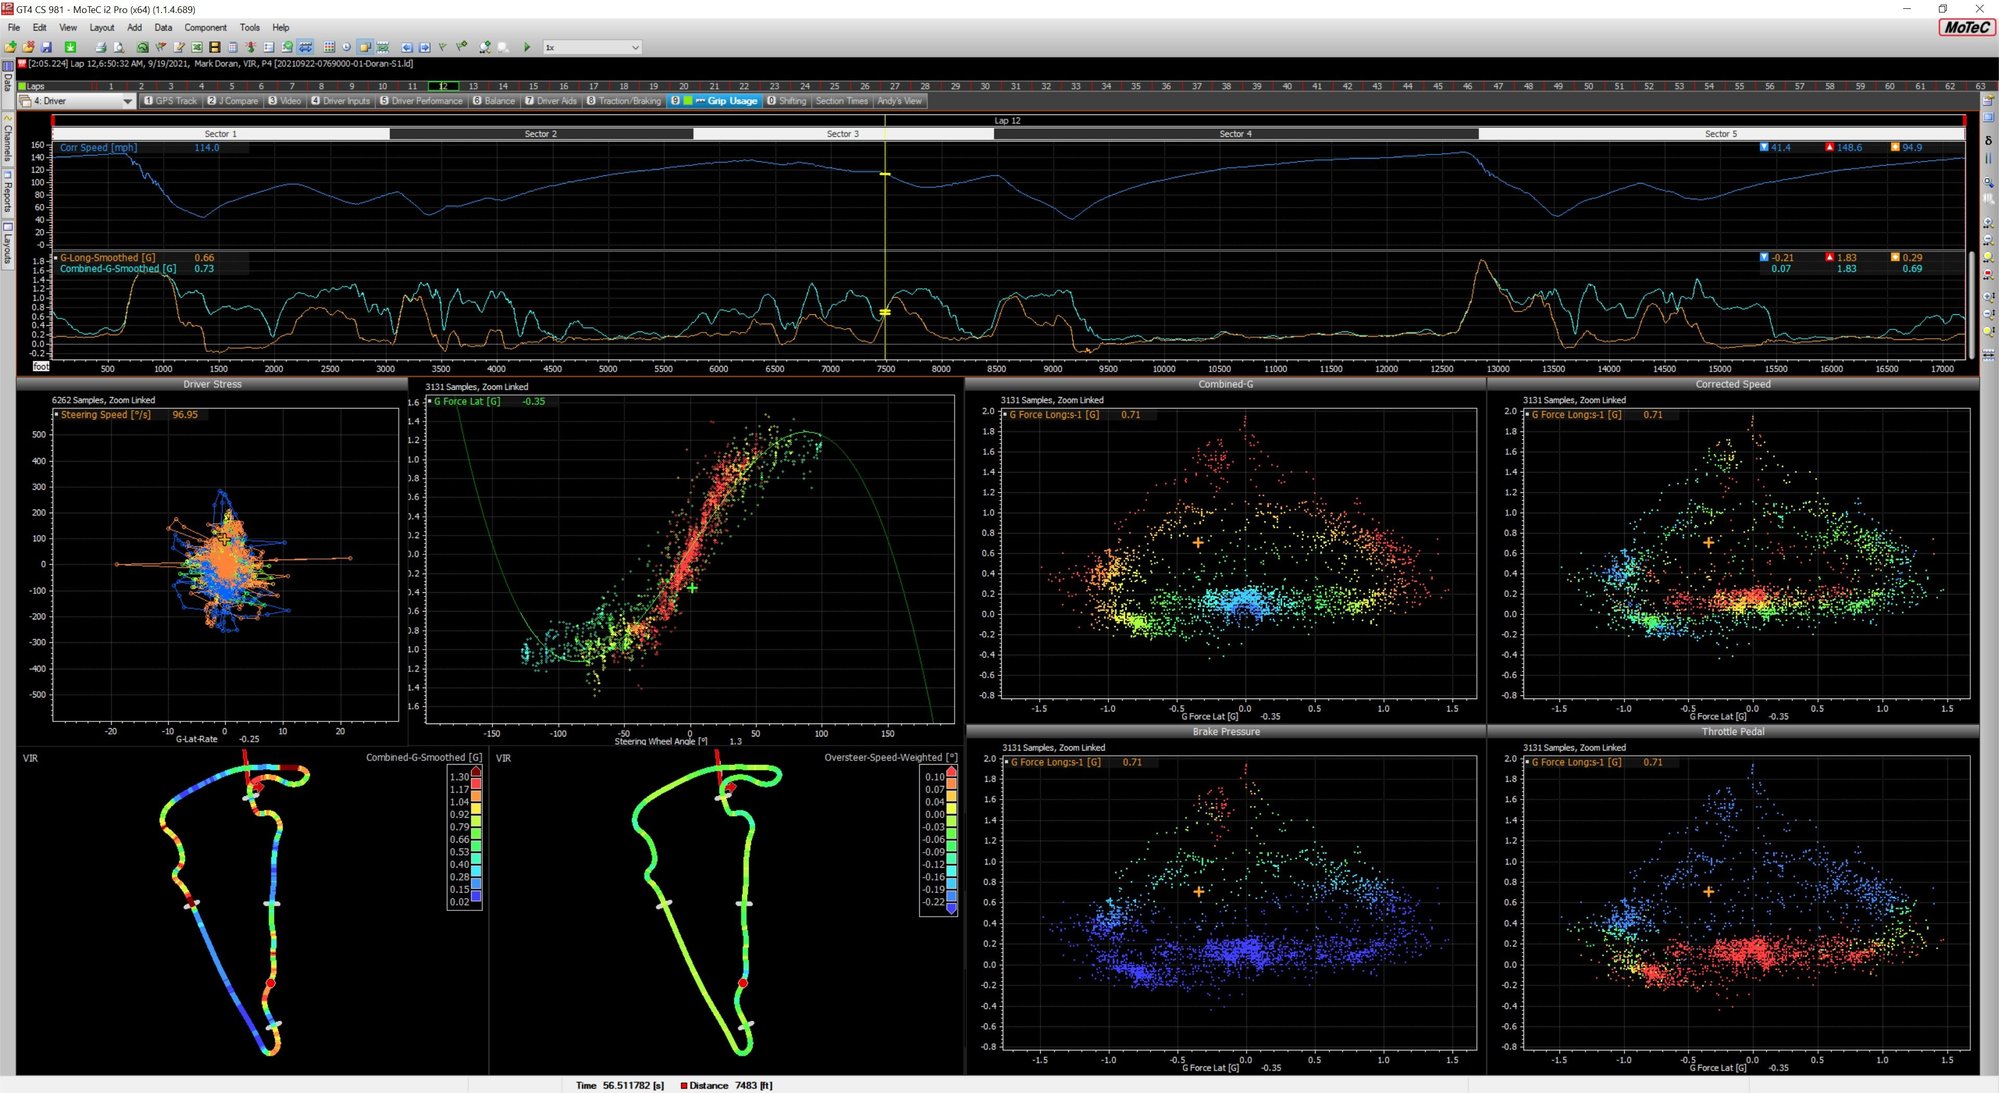
I like colorized charts and a track map to cross reference as well for looking at the G/G plot. This is a sheet I've been using with similar ideas.

There are a couple of John Block inspired things in here -- the "stress" chart lets me find the places on the track where I'm doing something abrupt with steering which usually means it needs a look-see (<cough>T3</cough>). I really like using Long-G and Combined-G overlaid together on a time/distance graph -- it's taken me quite a while to teach myself to get the rise in long G to lead to sustained (i.e. horizontal-ish) Combined-G indicating that I'm doing better at blending out of brake and into steering load (South Bend and Oak Tree look that way on this lap although I suspect the whole thing can move up a bit...combined G sustained could be higher). I've heard it said that if you see the combined trace dip after it reaches the sustained potential for the car then you have just found a "valley of opportunity" dip in the trace meaning that's a place you are under-using the available grip (T13/14 is a bit that way in this lap; braked a bit early I think so that's the opportunity).

The speed weighted oversteer is right out of Buddy Fey's book in case anyone is wondering -- yes, inducing more rotation (so more red-ish tones showing oversteer) is something I'm working on ).

Depending on what question I want to think about I start with the overall view and then dive in. In i2pro you click a chart on the page and F6 to maximize and you can see more detail (practically essential when at the track on a smaller screen ).

Big +1 for your point about highlighting a corner or section at a time too -- that really helps


The following 4 users liked this post by boxer-11:
kristap (11-10-2021), Matt Romanowski (10-14-2021), ProCoach (10-14-2021), ShakeNBake (10-15-2021)
Old 10-14-2021, 06:04 PM
  #3  
dasing
Advanced
 
dasing's Avatar
 
Join Date: Jan 2016
Posts: 50
Likes: 0
Received 14 Likes on 9 Posts
Default

Being able to colorize X-Y plots with a third variable is indeed an awesome feature.

Last edited by dasing; 10-14-2021 at 06:55 PM. Reason: Realized I was off topic
The following users liked this post:
Matt Romanowski (10-14-2021)
Old 10-14-2021, 06:24 PM
  #4  
ProCoach
Rennlist
Basic Site Sponsor
 
ProCoach's Avatar
 
Join Date: Jun 2008
Location: Durham, NC and Virginia International Raceway
Posts: 19,097
Received 3,270 Likes on 1,865 Posts
Default

SO glad AiM finally allows additional channel values as a color blend in X-Y plots. That’s a very powerful feature and visualization. Been in i2 Standard for a long time.
__________________
-Peter Krause
www.peterkrause.net
www.gofasternow.com
"Combining the Art and Science of Driving Fast!"
Specializing in Professional, Private Driver Performance Evaluation and Optimization
Consultation Available Remotely and at VIRginia International Raceway


Old 10-14-2021, 11:45 PM
  #5  
boxer-11
Rennlist Member
 
boxer-11's Avatar
 
Join Date: Sep 2013
Location: Olympia, WA
Posts: 451
Received 54 Likes on 37 Posts
Default

Originally Posted by dasing
Being able to colorize X-Y plots with a third variable is indeed an awesome feature.
Yeah, but your off topic is a pet peeve of mine with these analysis programs as well...so I'm going to respond anyway

I did talk the Apex Pro guys into adding polar reference lines. Pile on here for MoTeC i2pro

Showing G-G like it's a G-ball on your video overlay is just so obviously more intuitive to look at.
The following 2 users liked this post by boxer-11:
GtEE4 (10-15-2021), kristap (10-26-2021)
Old 10-15-2021, 01:22 PM
  #6  
dasing
Advanced
 
dasing's Avatar
 
Join Date: Jan 2016
Posts: 50
Likes: 0
Received 14 Likes on 9 Posts
Default

Geez. Off topic and hitting a pet peeve. What a post!

But seriously, thank you for the link.

Old 10-15-2021, 01:33 PM
  #7  
Matt Romanowski
Rennlist Hoonigan
which cost no drachmas
Lifetime Rennlist
Member


Rennlist
Site Sponsor
Thread Starter
 
Matt Romanowski's Avatar
 
Join Date: Dec 2001
Location: Manchester, NH
Posts: 12,640
Received 967 Likes on 581 Posts
Default

Originally Posted by boxer-11
Yeah, but your off topic is a pet peeve of mine with these analysis programs as well...so I'm going to respond anyway

I did talk the Apex Pro guys into adding polar reference lines. Pile on here for MoTeC i2pro

Showing G-G like it's a G-ball on your video overlay is just so obviously more intuitive to look at.
I want to say I have seen a way to get the lines. I will think about it and see. It was adding a math channel to create the line.
Old 10-15-2021, 01:49 PM
  #8  
ProCoach
Rennlist
Basic Site Sponsor
 
ProCoach's Avatar
 
Join Date: Jun 2008
Location: Durham, NC and Virginia International Raceway
Posts: 19,097
Received 3,270 Likes on 1,865 Posts
Default

Originally Posted by Matt Romanowski
I want to say I have seen a way to get the lines. I will think about it and see. It was adding a math channel to create the line.
Ray Phillips was the first one I saw do it, a long time ago.
Old 10-15-2021, 09:54 PM
  #9  
dasing
Advanced
 
dasing's Avatar
 
Join Date: Jan 2016
Posts: 50
Likes: 0
Received 14 Likes on 9 Posts
Default

Thanks guys.

Old 10-18-2021, 06:05 PM
  #10  
Matt Romanowski
Rennlist Hoonigan
which cost no drachmas
Lifetime Rennlist
Member


Rennlist
Site Sponsor
Thread Starter
 
Matt Romanowski's Avatar
 
Join Date: Dec 2001
Location: Manchester, NH
Posts: 12,640
Received 967 Likes on 581 Posts
Default

Originally Posted by dasing
Thanks guys.
I got some positive feedback from the software team and I think people will be happy
The following users liked this post:
boxer-11 (10-19-2021)
Old 10-18-2021, 08:19 PM
  #11  
dasing
Advanced
 
dasing's Avatar
 
Join Date: Jan 2016
Posts: 50
Likes: 0
Received 14 Likes on 9 Posts
Default

Fantastic!


Quick Reply: GSum Views


All times are GMT -3. The time now is 04:25 PM.