When you click on links to various merchants on this site and make a purchase, this can result in this site earning a commission. Affiliate programs and affiliations include, but are not limited to, the eBay Partner Network.
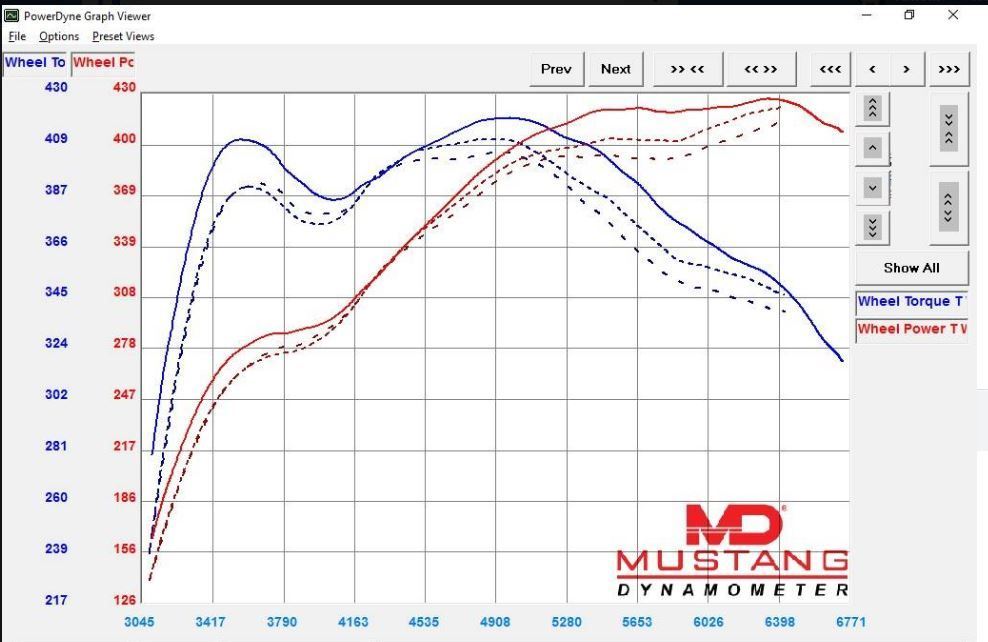
Interesting that there's meaningful separation starting at 2.9K RPM, only for the curves to re-converge at 3.9K RPM before the largest sustained delta between 4.5K-6.4K RPM. I wonder whether this same pattern would be observed without a tune? Nevertheless, it's an outstanding result and that SOUND is everything I hoped it would be! Congrats on a sick, sick Targa!
Now I just need to get my GTS of out port and my Kline Inconel system out of customs clearance lol.
medtech: If only I didnt have a wife that spends faster than I can earn it and two young kids, I would have done that inconel system in a heart beat. I'm Jelly...
As far as the convergence, I wish we were able to get the print out of the thin line graph which would have shown more clearly that the Headers are essentially producing power above stock everywhere.
The one thing I noticed with the Klines that I have not seen from any other manufactures graphs is that at no point in the power band does it fall BELOW the stock headers. Its better everywhere.
Other charts show power increases at similar rpms, but those charts also show areas in the power band where they actually perform WORSE. With the Klines its better everywhere.
I'm like a little kid so happy with the decision. When the full exhaust goes on and stage 2/custom tuning is available this is going to be an absolute monster. Can't wait. You're gonna be smiling ear to ear with the sound.
Great results mate and thank you for all the kind words we are really happy that they performed as expected and beyond. Great power under the curve! One interesting thing I would like to see when the next few gentleman test is if we will gain even more up top on an otherwise stock car. I say this because on a car that’s already been calibrated and has a sport exhaust or cats the Delta definitely changes. With custom tuning we can get even more but I’ll be very interested to see what happens up top on a factory car that is not already being squeezed of it’s efficiency if that makes sense? I think we will find something even more impressive and I’m sure results will come soon. Additionally when the custom tuning or even stage two software comes out I think we will also see even better results in different areas! So they will hopefully be plenty to compare and average out. Again thank you for doing this and we couldn’t be more pleased!
lol i expected the person SO KEEN on dyno charts having a little more knowledge on how to read them...
Agreed. For a real interpretation, Both Vektor and Klein made no gains below 4,400. Around the same time they both started making power.
The Klein topped out about 6,600 where the green line is on top and pretty much remained at before power levels after that.
The Vektor however continues to make power up top and remained well above the before curve.
At the moment the Vektor are actually superior, just comparing these two graphs. However, this could be explained by the fact that PTS has got 200 cell CATS. To confirm if this was the factor both cars would need stage 2 tune, and then see where they ended up. I would suspect that the Klein would improve more up top once stage 2.
I am not bagging Klein. I love Klein, I think they sound amaizing. But just reading the dyno, I would not be saying they made power from 2,500 to redline. That is just not true. They pretty much started making power at the same place, but went back to the before power at the top.
I will not dignify your statement, all I will do is point people to the graphs to determine for themselves what gains were made and where they were made.
I will not dignify your statement, all I will do is point people to the graphs to determine for themselves what gains were made and where they were made.
Nuff said. Graph tells the whole story now..
We actually agree on this. The graph tells the story. You need to understand that they are not accurate to a micro mm. When two lines are close together, they are the same. You can do 3 runs. At the start of the graph, one might be on top on run 1. Then below on run 2, and then on top of each other on run three. The fact a cherry picked example was chosen, that just happend to be on top doesn't fool anyone who has experience.
You could have posted the one where it was below and my comment would have been the same. I know to ignore that. Not try to make a massively huge statement that they create power everywhere. Its not true.
Everyone who can read a dyno will understand. With more experience you will as well. What is before 4,400 is nothing. Regardless whether the line was slightly below, exactly on par, or slightly above. That's just dynos.
It should not be interpreted as making or loosing power there. it is the same.
I am not in Florida or I would have gone to BGB as John is a true gentleman and as knowledgable as they come.
I am in CT so I used "The Shop" in Norwalk for the Dyno testing. Not so easy to find all wheel Dynos and he has one.
Mustang, not Dynojet so numbers need to be adjusted upwards by 15-17% to compensate for Dynojets higher numbers.
Nice. I had almost identical results on a mustang dyno.
flsupraguy: Any chance you could post up your dyno chart on this thread for comparison? I don't know if you have done so in the past, but I would love to see if the charts line up in a similar way. THX
flsupraguy: Any chance you could post up your dyno chart on this thread for comparison? I don't know if you have done so in the past, but I would love to see if the charts line up in a similar way. THX
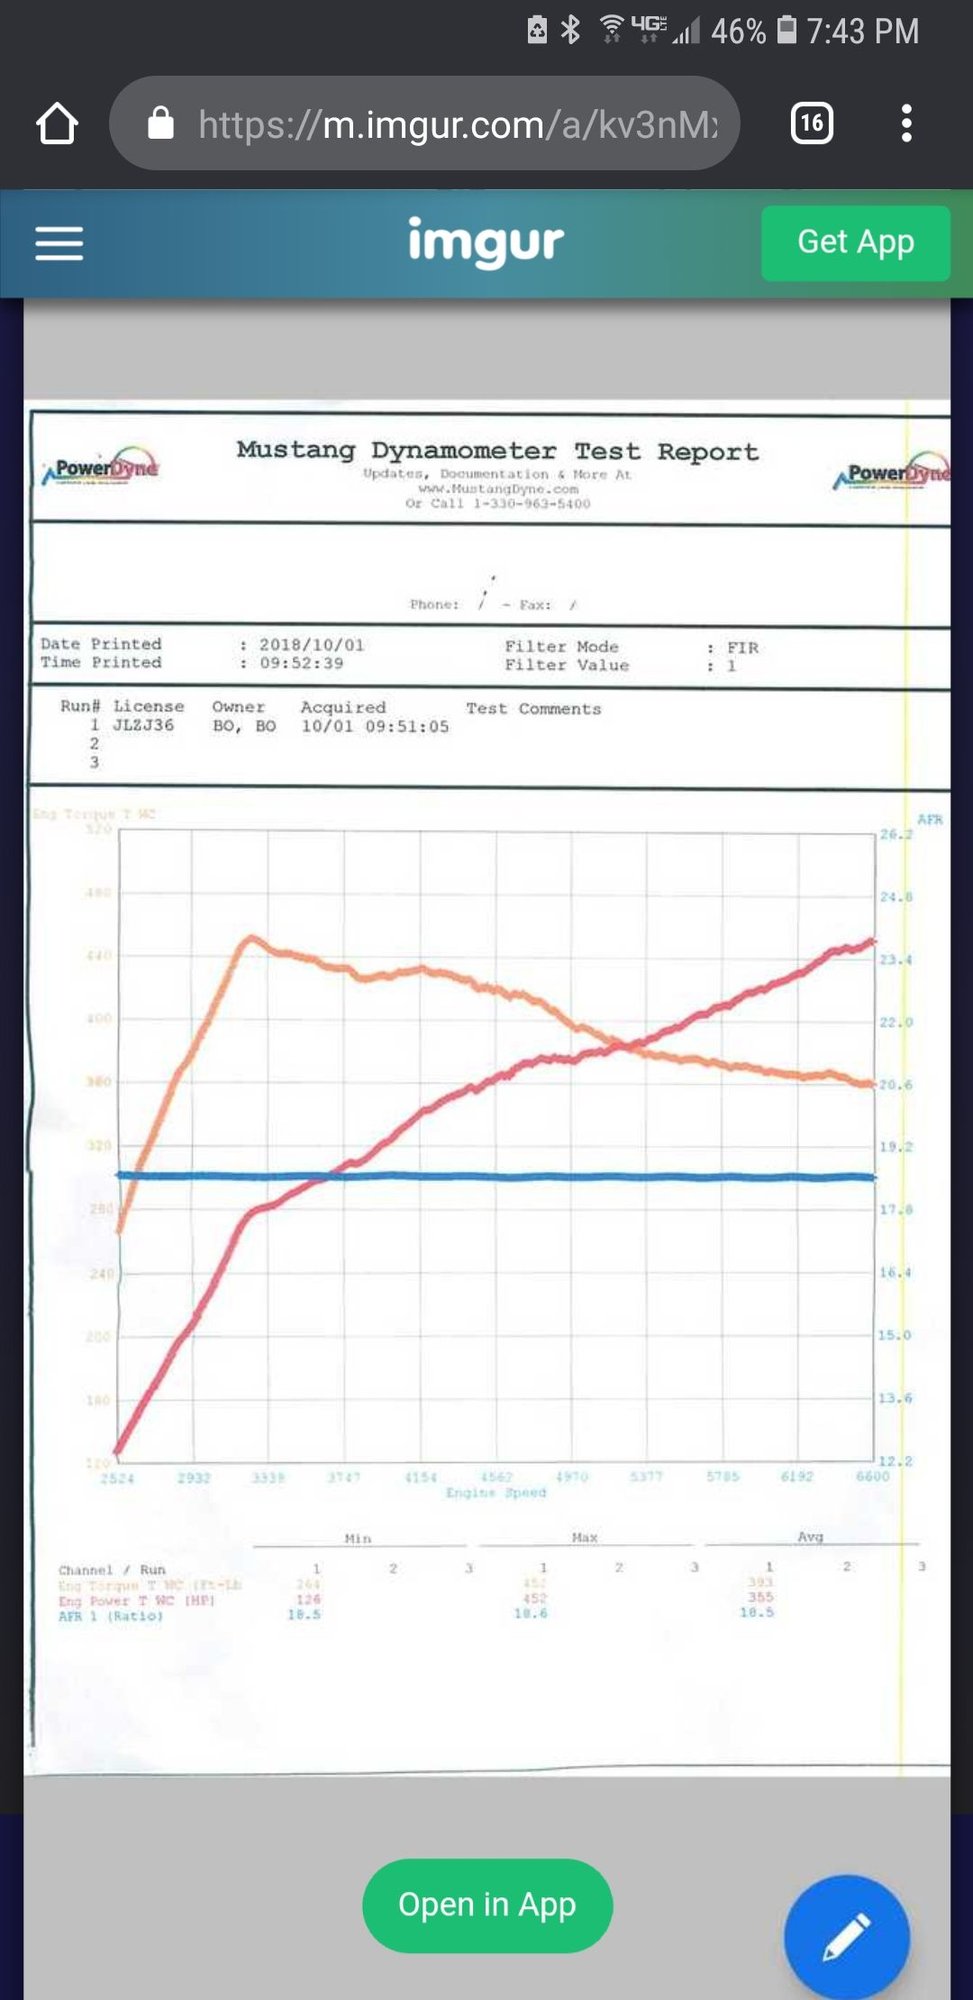
Heres baseline on mustang dyno (with just catless agency powe exhaust)
Heres after with ams ic's, cobb tune, ipd plenum, bmc filters, kline headers, and agency power catless back exhaust (which was on during baseline). Before and after runs were done on same mustang dyno in 100 degree plus florida warehouse.
One question regarding the sound - you mentioned you didn't notice too much difference upon install, but you are now really impressed? I watched the dyno video, sounded pretty similar to other dyno videos.
My guess is the bump from ~3000-3900 is a boost overshoot as the turbos spool up faster with the headers and cats combo. So basically, the computer is too slow to react.
Vektor saw similar on their dyno plot from their in-house dyno with Cobb Stage1 91-oct tune and headers, stock everything else. Grabbed from their FB page.
I blew up the chart a bit to make it easier to read, drew in some lines to make it easier to determine the power/tq levels, and drew in 'averaged' power lines because there's a lot of noise/fluctuation. Based on the peak numbers recorded by the dyno, peak gain of 8whp (~1.7%) and 18wtq (~4.2%). Though the peak torque gain might be a little deceptive if it's due to an overboost/spike condition. Max power gain looks to be about at 5790rpm, 423whp/400whp, so ~23whp or ~5.8%. Max torque gain looks to be at the same spot, roughly about 383tq/363tq, so about 20wtq, about 5.5%. That's really roughly eyeballing it. Of course, car was dyno'd different days, yada yada.
But like I told PTS-BRG from the very beginning, the stock headers are crap and there was room for lots of improvement. And all 3 brands have proved that out. Also, the dip in HP at ~6200rpm, I bet the timing got retarded there a few degrees which keeps the power curve from being nice and smooth. There's definitely room for improvement in the tune. So it'll be great one the custom tune capability is more readily available.

 11-06-2018, 02:14 PM


 No way in hell to gain almost 90whp with bolt-ons on any naturally aspirated 911.