When you click on links to various merchants on this site and make a purchase, this can result in this site earning a commission. Affiliate programs and affiliations include, but are not limited to, the eBay Partner Network.
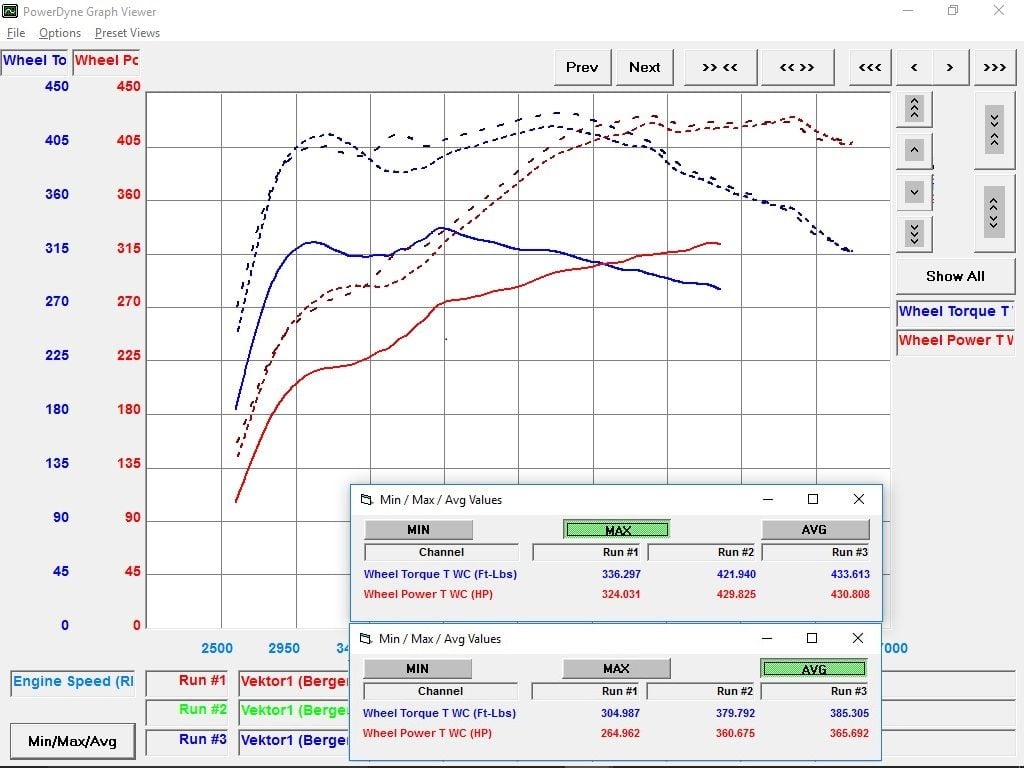
Don't think I've posted this, I'm not even certain I've looked at it before, but we've been asked a few times about how much power is the car making now compared to when it was stock.
Run1 Stock, Run 2 with Vektor Headers coated and Cobb OTS Stage 1 map, Run 3 with all of Run 2 plus modified OEM exhaust (valve relocation). Usually you see plots with only the MAX values shown, but I added the Average values as well, as it tends to give you a better idea of what to expect as a whole across the plot.
Thanks no worries I cant wait a few weeks but want to experience the stock car as well so I really appreciate these
Of course. I did the same thing. Drove the car for a few months just taking it all in; pushing it, learning the limits, shortcomings, quirks and of course how awesome the car/platform is.
I read the MotoIQ article and had one question. In the comparison photo of these to the stock manifolds, the ports on these appear noticeably smaller than stock. Can you advise on that please?
I read the MotoIQ article and had one question. In the comparison photo of these to the stock manifolds, the ports on these appear noticeably smaller than stock. Can you advise on that please?
So if you look in this pic, you can see how the OEM ports are flared out because of the welding process that's used. It gives the illusion that the port is bigger than it really is.
Our flange has a distinct edge. It's also the sized correctly to the head port. Comparing ours to OEM you will also notice the OEM ports vary in size (cross sectional opening) as well as how centered they are on the actual port. These are all due to manufacturing deviations from the process that's used to assemble them. The CNC design we use assures identical port geometry as well as location.
Don't think I've posted this, I'm not even certain I've looked at it before, but we've been asked a few times about how much power is the car making now compared to when it was stock.
Run1 Stock, Run 2 with Vektor Headers coated and Cobb OTS Stage 1 map, Run 3 with all of Run 2 plus modified OEM exhaust (valve relocation). Usually you see plots with only the MAX values shown, but I added the Average values as well, as it tends to give you a better idea of what to expect as a whole across the plot.
OEM valve relocation you say?!
Could you provide some details of what was done here please? Very interested!
Could you provide some details of what was done here please? Very interested!
Yes of course! One of the biggest complains from enthusiasts is the low sound levels from the exhaust. Adding some power is always a nice side benefit, but wasn't what we were after here. With the EPA cracking down on emissions related activities, retaining the OEM cats was a goal. If you're not familiar with the letter of the law, in short, it states that the OEM cat must remain in place for 10 years. After 10 years an approved OEM replacement (meets OEM requirements) can be used. A little known fact, we all have a 10 year warranty on our cats from the factory. This is for ANY car sold in the USA.
So we modified our OEM exhaust by relocating the 'sport' valve directly after the cat, giving a straight shot to the tip.
Don't think I've posted this, I'm not even certain I've looked at it before, but we've been asked a few times about how much power is the car making now compared to when it was stock.
Run1 Stock, Run 2 with Vektor Headers coated and Cobb OTS Stage 1 map, Run 3 with all of Run 2 plus modified OEM exhaust (valve relocation). Usually you see plots with only the MAX values shown, but I added the Average values as well, as it tends to give you a better idea of what to expect as a whole across the plot.
Looks like a solid 10-12wtq gain from 4k-6k rpms. It appears the stock muffler is a decent restriction. I guess the cats or turbos are becoming the dominant restriction past 6k. It is making over 100whp more compared to stock now, so those baby turbos are probably starting to choke out, ha!
I would guess the turbos, more than the cats. By my calcs the OEM cats have a bit more to go before they are the dominant bottleneck. I suspect the tiny turbos are close to tapped out. External wastegates should free up a good bit of power as it lowers pre-turbo backpressure while maintaining target boost
Coated headers IN STOCK! The lead-time for Swain Tech Multi-Layered Ceramic Coating is often times 4 weeks or more due to the nature of applying many coatings over weeks-time. Trying to stay ahead of the curve we sent some extras along with the last batch

 11-07-2018, 09:27 AM