When you click on links to various merchants on this site and make a purchase, this can result in this site earning a commission. Affiliate programs and affiliations include, but are not limited to, the eBay Partner Network.
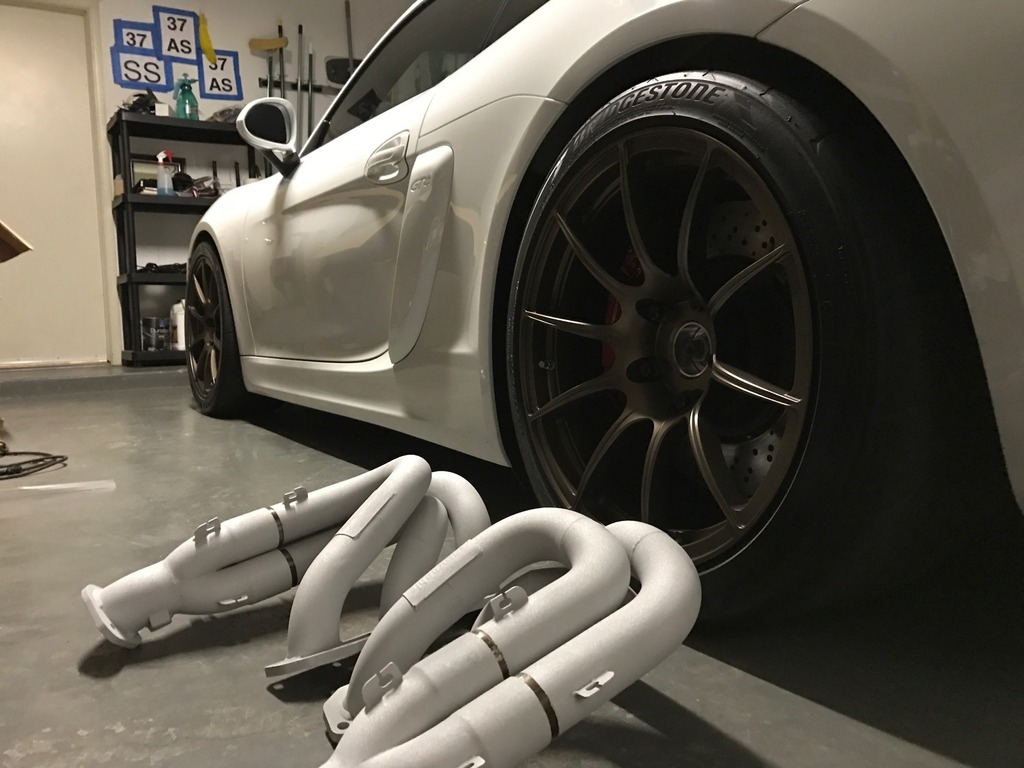
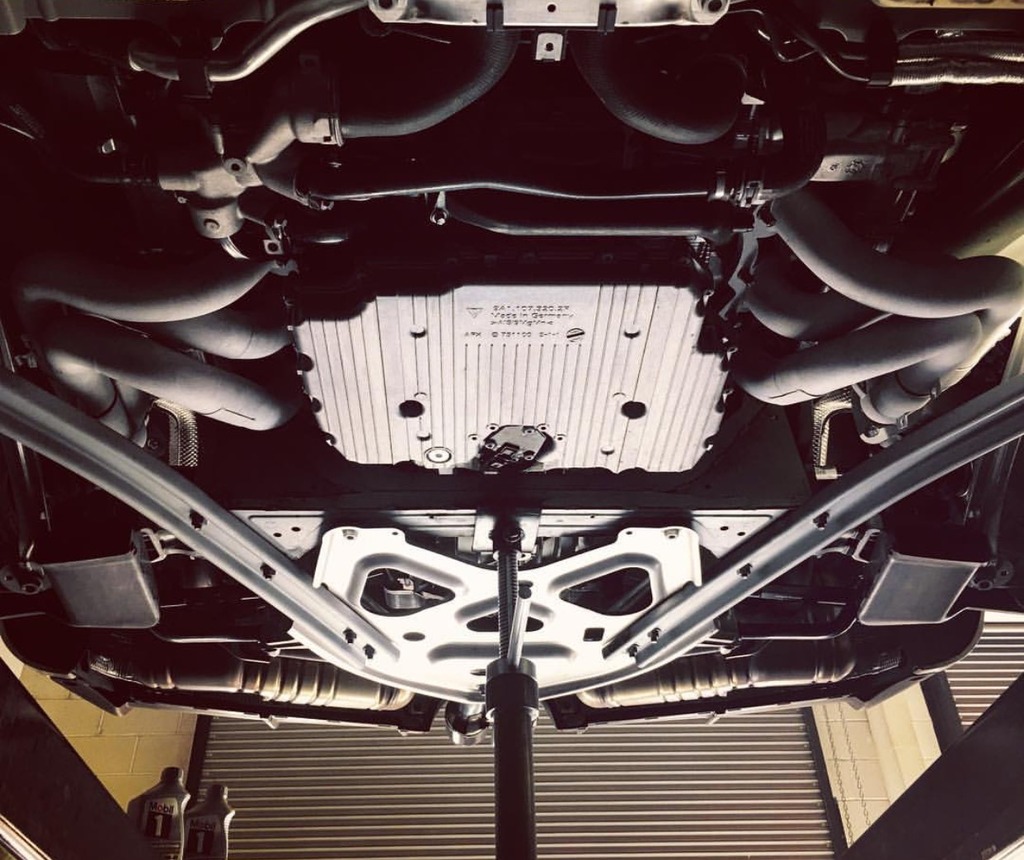
Recently installed Carpgraphic Race headers and went through the custom tuning process with John. I had the headers Swain coated first.
The back and forth with John was well worth it. Below are some pics and a dyno chart. I'm really happy with the improved low end torque. And the sound is pure race car with the valves open. However it can be civil if driven so, with the valves closed.
Overall, was a great, no BS process working with BGB. I will continue going to them for any upcoming changes to the car.
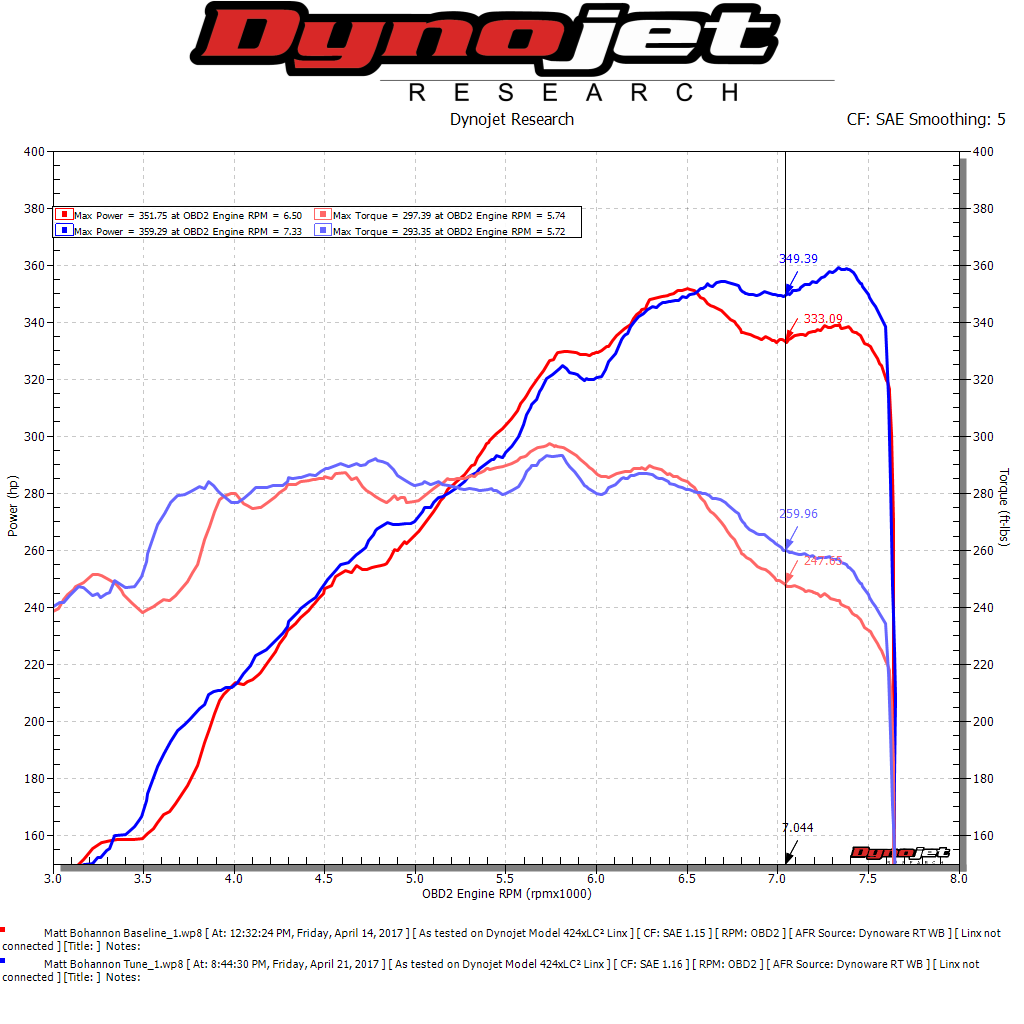
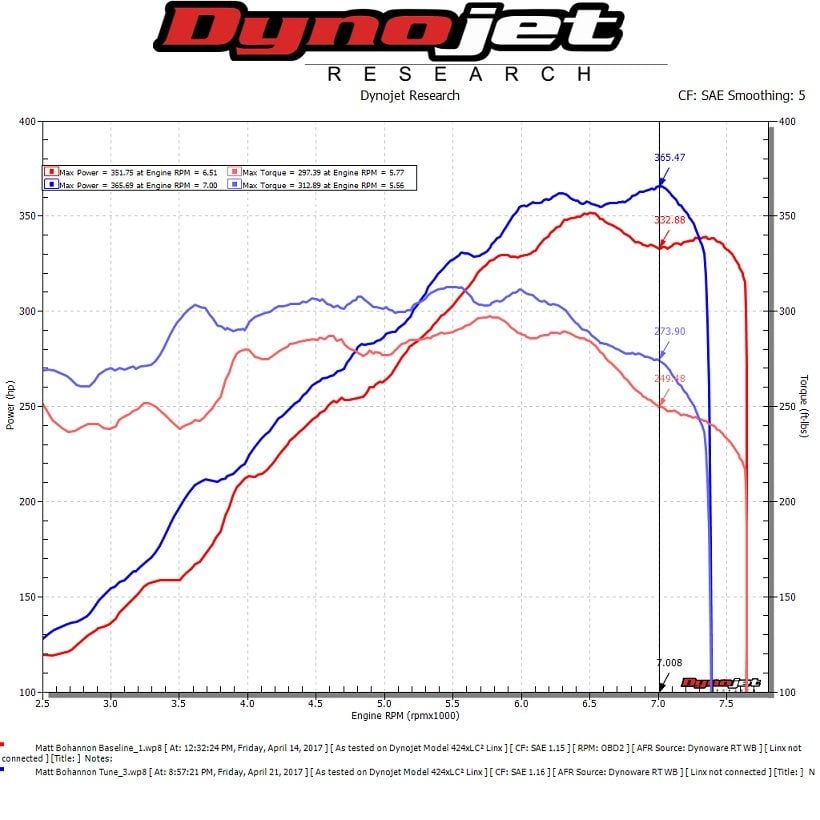
Baseline was done a few days prior to the "after" dyno. Both runs on our crappy 91 gas. Made 3 "after" runs. Interestingly as the car got hotter it kept making more power. All the runs were done in 4th.
Why is the power the same at 100 mph, but not the torque?
Also odd that HP lines don't intersect Tq at the same speed, no? I thought this typically happens at 5.2 to 5.3k RPMs. Maybe differences in corrections for atmospheric conditions or incorrect gearing inputs (obviously the dynamometer isn't getting engine speed from CANbus). Top end power curve looks great though! Enjoy!
Why is the power the same at 100 mph, but not the torque?
Not sure whats relevant about 100 mph, there are other places where there is a torque gain and no power gain (70-80mph). May be simply that the car is exhaling better than its inhaling.
Originally Posted by jlennox
Also odd that HP lines don't intersect Tq at the same speed, no? I thought this typically happens at 5.2 to 5.3k RPMs. Maybe differences in corrections for atmospheric conditions or incorrect gearing inputs (obviously the dynamometer isn't getting engine speed from CANbus). Top end power curve looks great though! Enjoy!
I believe they do not cross at the same point (5250 rpm) because the scale is not the same for power and torque on the graph. Left side is power, right side is torque. Not sure though.
Maybe John will chime in with some more definitive answers. EDIT: Beat me to it. Right on que ^
Maybe John will chime in with some more definitive answers. EDIT: Beat me to it. Right on que ^
Right on schedule!
I have found that the larger throttle body really shows its strength over 5K RPM so i think you're probably right that it's not getting enough air over that point and i would have to agree with you that down below we are flowing better on exit now too! I think that it's easier to look like a hero putting a tuned file on a car with high flow exhaust. I was impressed with the gains considering how much i had to back down the file for the 91 octane and hot intake air temps.
I found some stuff last night combing through the logs and i am going to have another file for Matt to try which i will send to anyone else whom i've done thus far. I think that the AP is a real value for the dollar because you have monitoring but also very invasive logging which allows me to look at everything and rely less on conjecture.
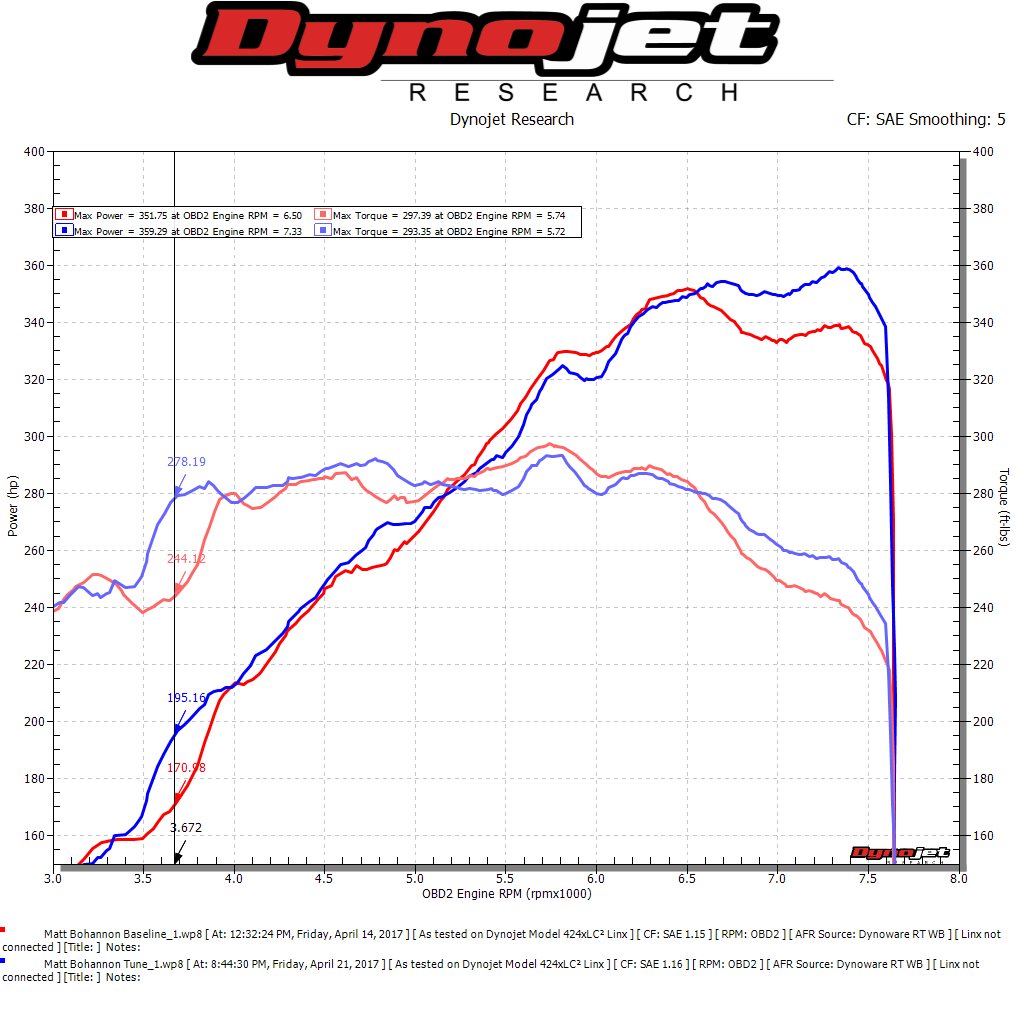
You CAN NOT be increasing TQ but not increasing HP, for a given RPM range... such as from 70-80 and 95-105 mph.
HP and TQ are DIRECTLY mathematically correlated, through RPM speed... if one increases, the other one has to increase as well. This is why with proper 1:1 scaling, they must cross at 5252 RPM.
This is BASIC, ELEMENTARY dyno and tuning 101.
Which means, something is wrong with this graph... which means, it is suspect and useless when it comes to the data.
I am NOT saying the kit isn't making power... and not trying to be a d!ck, just saying that this dyno graph and whatever measurement ranges, sensoring and scale used is worthless when it comes to analyzing the gains because something is incorrect.
Yes, the curves are bogus / erred in some way, or the scaling is different between the curves yet only one scale is shown, etc.
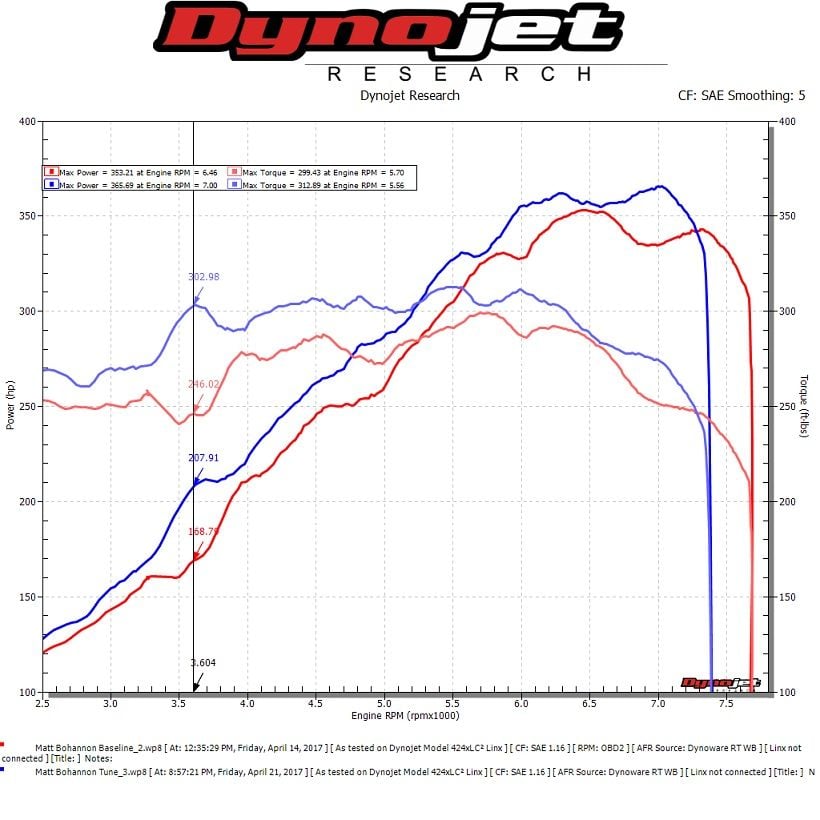
I asked the owner for the original files and then we both decided to wait til he goes back with the revisions i am waiting on from Cobb; however since people are wondering if something is "bogus" or "suspect" and that the data is "worthless," I am just going to take the files he sent me that i dropped into the Dynojet software.
Next week will yield greater gains since i will have control of that which I am missing.
For now, this is what should have been posted all along before people started questioning intentions and motives.
Those plots are physically consistent. Clearly a potting issue before.
Those plots are physically consistent. Clearly a potting issue before.
For what it's worth, i tried to replicate the original graph and do it in mph AND have mismatched max values for TQ/HP and i couldn't. And yes, the peak numbers are lower and yes, the file is not complete because i want to lean it out further but at the risk of people criticizing the results, i don't want people thinking anything shady is going on.
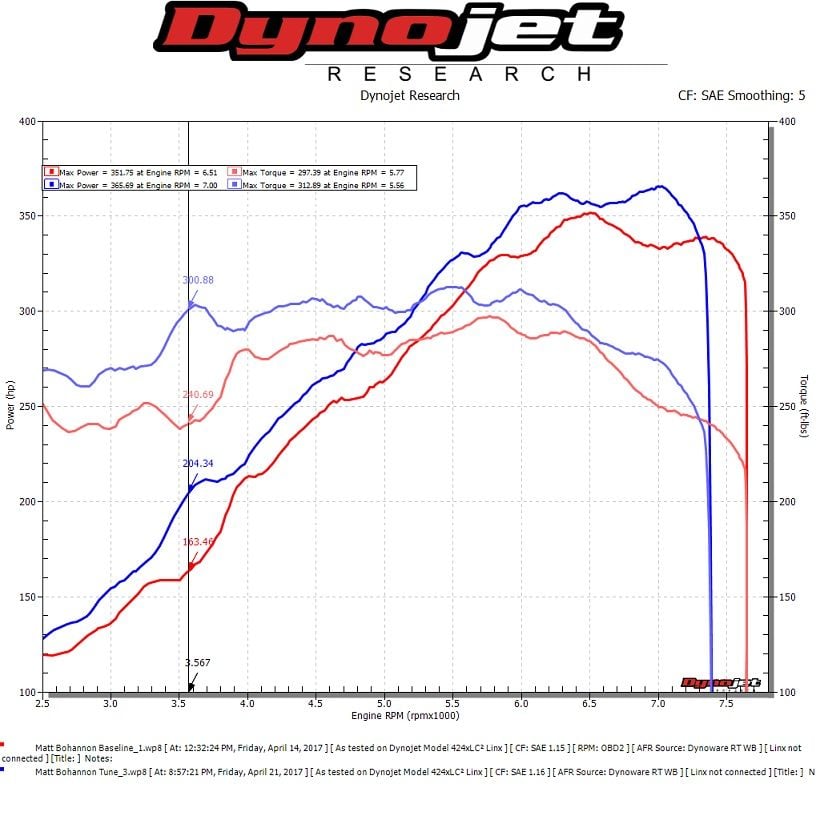
It's no secret by now that the stock tune is aggresive and on the edge of knocking and that we are getting more HP by reducing IGN timing so the OE curve is going to look better in places. I am not done though and you will all see the final results when i get what i need from the software developer tomorrow.
I went through these files again. The runs were not labeled when emailed to me. The graph above that i posted earlier today is actually a comparison of the two worst runs. When i originally loaded them in the software i mistook the first pull with the mods to be the best of the stock runs.
The two runs the customer posted yesterday are the worst vs. best case comparison but I think tihis has always been a bit salesy and i think a lot of shops compare worst vs best for marketing reasons. The car always makes more power on the dyno run after run til it plateaus from heat soak on runs 3, 4 & 5. To reproduce the original comparison posted yesterday i added those runs but again, it is a best vs. worst case scenario. If I had a 3rd baseline we could toss out the best and worst and use the mean but i didnt.
It looks like the blue hp lines are shifted to the left by 250 rpm. The blue torque lines are shifted to the left by 250 rpm and lifted so that they still cross the hp line at the proper rpm. It's hard for me to believe that the mods have a constant increase in torque and hp across the rev range, yet the high hp peaks at 6500 and 7400 rpm are shifted down by 250 rpm compared to stock and the engine runs out of steam at the top end 250 rpm sooner (which doesn't make sense because it should breath better with mods).
this is my dyno sheet... hub-dyno used... for comparison...
lower number stock
medium number only sport headers
higher number headers+TB+plenum+Pro tune
 05-03-2017, 03:00 PM


 Right on schedule!