When you click on links to various merchants on this site and make a purchase, this can result in this site earning a commission. Affiliate programs and affiliations include, but are not limited to, the eBay Partner Network.
Working with some of the tire engineers on this sort of stuff has been very interesting.
The tire engineers I work with have a specific target range they want to see.
This can be a useful tool to both establish a point of underutilization of the tire, as well as establishing an overheating threshold.
Every manufacturer is different, and every carcass design/tread compound is slightly different, in my experience, but their target temp recommendations are quite specific.
__________________ -Peter Krause www.peterkrause.net www.gofasternow.com
"Combining the Art and Science of Driving Fast!"
Specializing in Professional, Private Driver Performance Evaluation and Optimization
Consultation Available Remotely and at VIRginia International Raceway
The tire engineers I work with have a specific target range they want to see.
This can be a useful tool to both establish a point of underutilization of the tire, as well as establishing an overheating threshold.
Every manufacturer is different, and every carcass design/tread compound is slightly different, in my experience, but their target temp recommendations are quite specific.
Here's a great article on tire temps. It's from autocross, but lays out some great framework for working with IR temps. The sensor info/problems don't apply to these sensors, but the analysis and data layout is good. http://thinkfastengineering.com/2012/08/solo-heat/
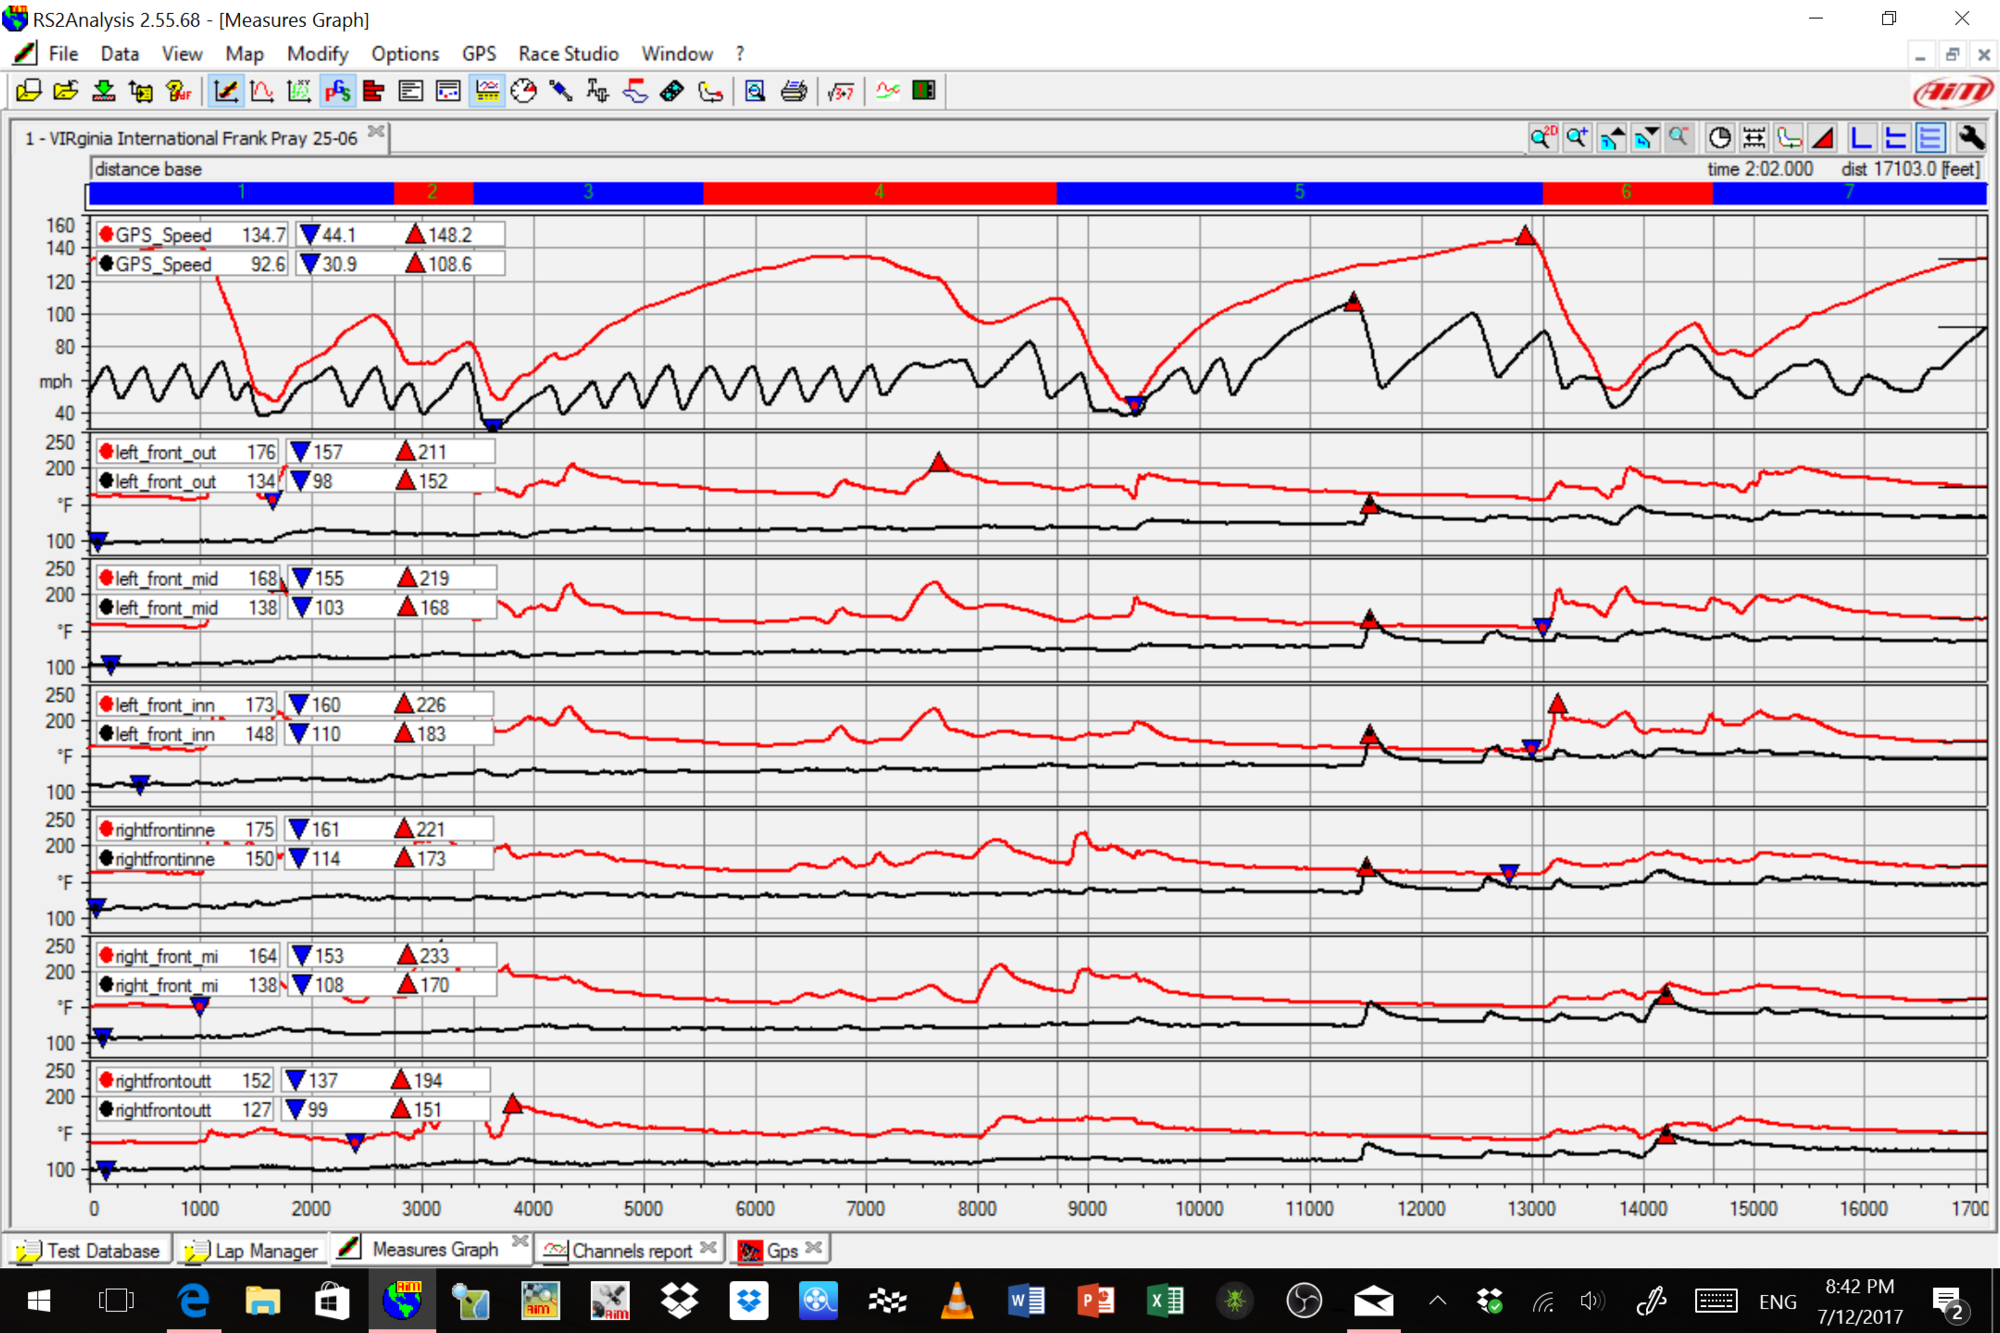
Here is a graph from my first event at VIR with the sensors. These are two laps from the Enduro race on this graph (front tires only - three sensors across each tire):
1) My warm-um (out) lap behind pace car (BLACK)
2) An average lap later in the session (RED)
Top Graph is speed, followed by the left tire (outer, mid, inner) and right tire (Inner, mid, outer) at the bottom.
Key takeaways:
- I was able to get about 40 deg of average temperature increase during the out-lap
- Peak temps during the later lap were in the 230 deg F range
- We set up the car to show even average temperatures during a lap (which means asymmetric camber) across each tire
Ambient temp was 84 deg. Track surface temp was approx. 110 deg.
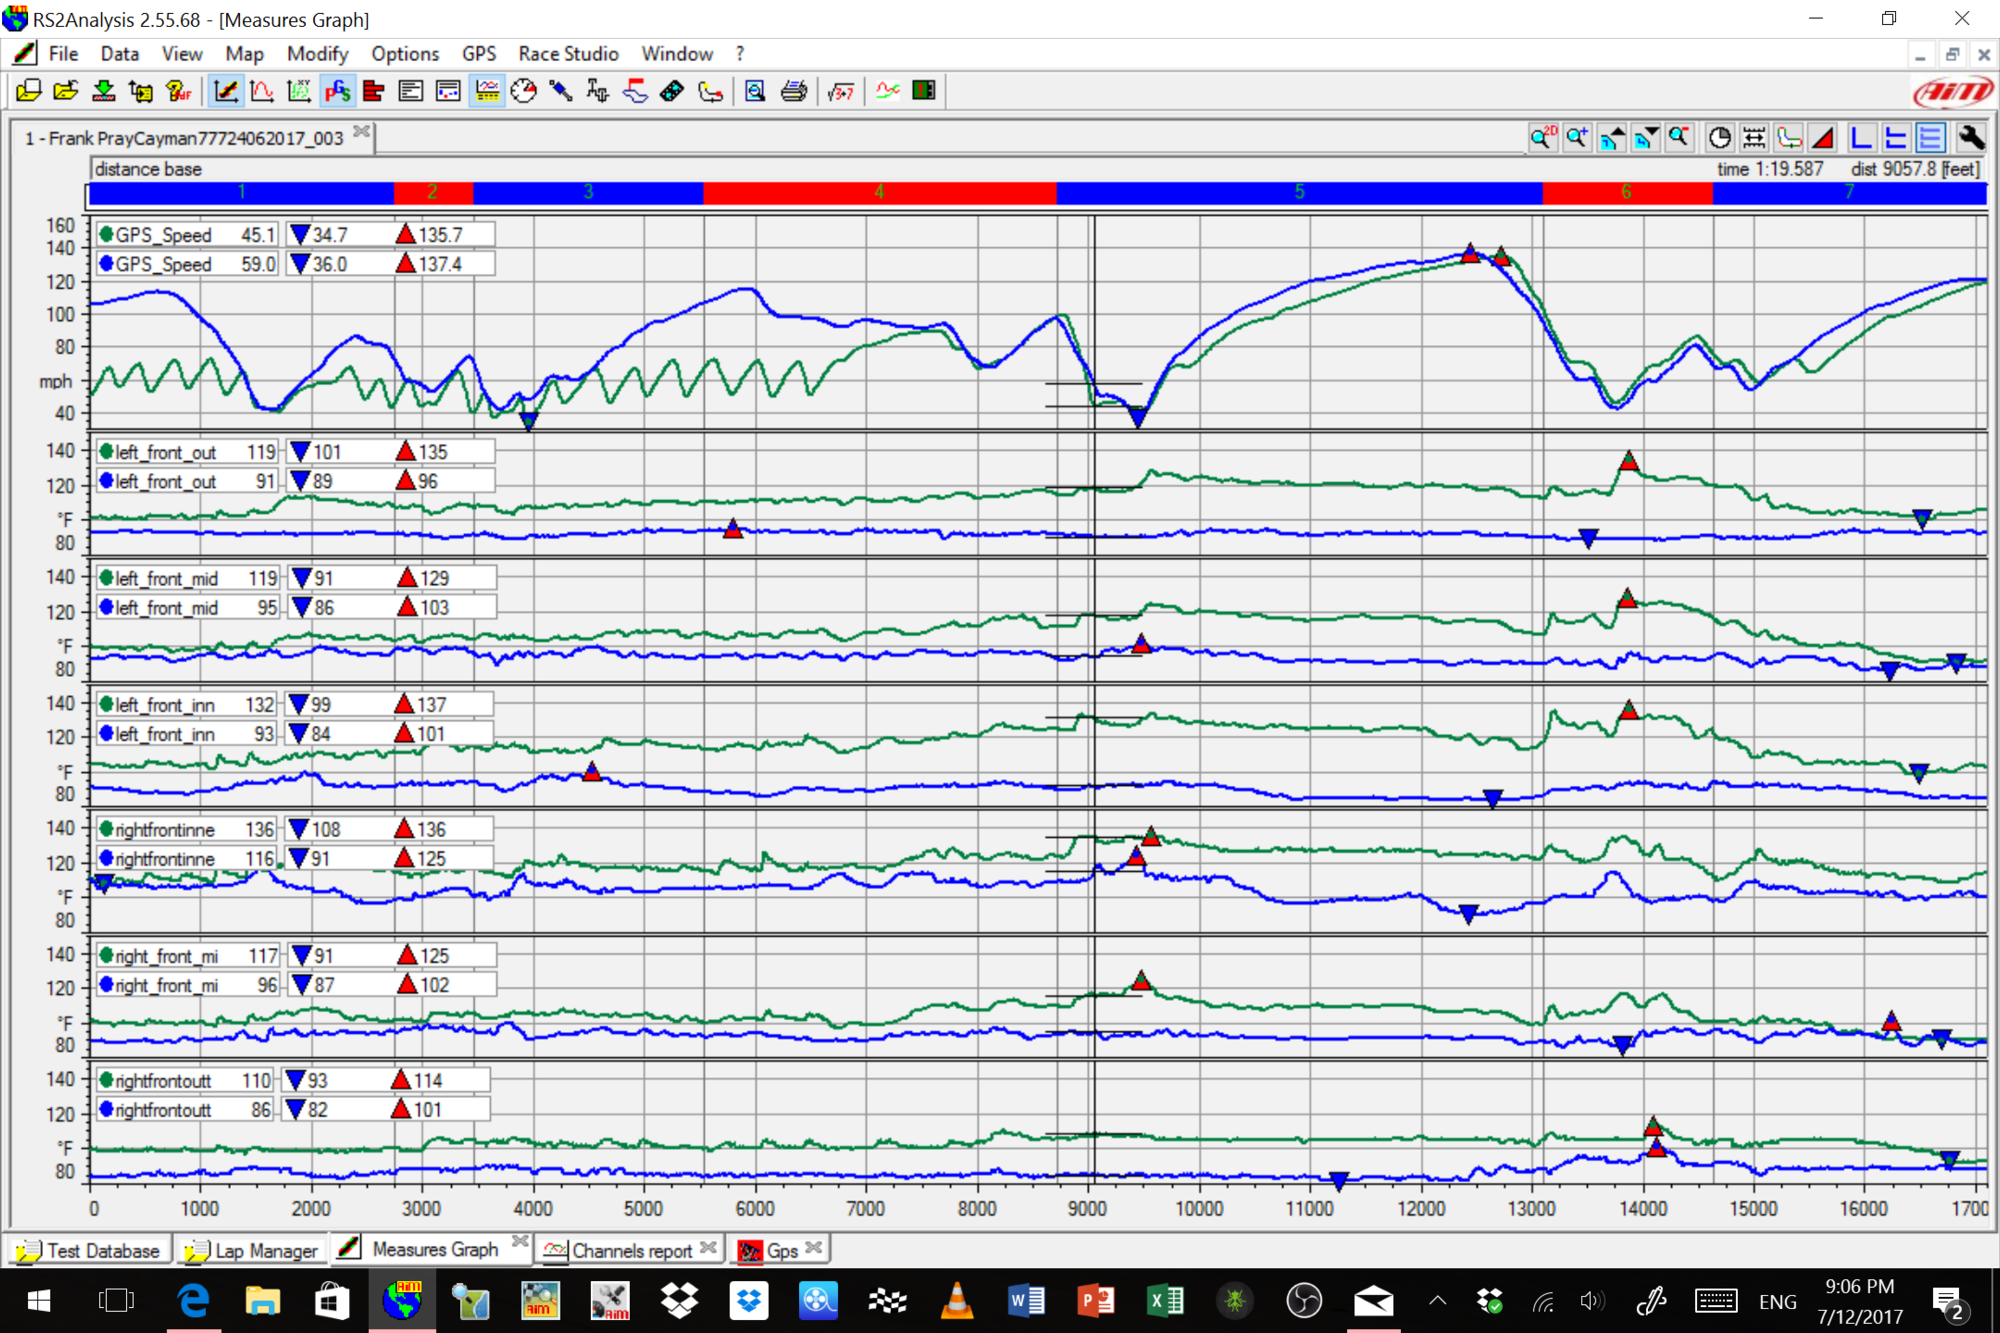
Here is another graph from VIR with the sensors. These are two laps from Race 2, where we all started on slicks but as soon as we started the out lap it was pooring rain for the entire session (again front tires only - three sensors across each tire):
1) My (very quick) warm-um (out) lap behind pace car (GREEN)
2) An average lap later in the session (BLUE)
Top Graph is speed, followed by the left tire (outer, mid, inner) and right tire (Inner, mid, outer) at the bottom.
Key takeaways:
- Rain was pooring so bad as I came out of Oak Tree during the out lap that I did not dare to be too aggressive with the warm-up as it got very slippery. Plus the pace car was pretty quick on that lap.
- I barely was able to maintain any temperature during the out lap
- In the later lap (still on slicks) peak temperatures were only in the 90 deg. F range
Nice information. Are you going to make any changes to the setup based on the temps you saw in the dry races?
Actually, yes. We stood up (reduced camber of) the right inside wheel by 0.5 deg which significantly reduced right inside peak tire temps to what you see in the charts above.
Do you have a hot lap where you go into the pits? It would be interesting to see how much of the temp gradient across the tire you loose as the tire cools down. Can you post a pic of that zoomed in showing ony one tire so it is easier to see?
Sorry for the dumb question - would it be possible to retro these to a VBOX?
Really cool, I would love to see what's going on with a camber curve challenged car like the cayman.
Yes, it would. An MICIN01 could accommodate four. Scale and offset for the sensor curve and you're set. Could even add an element (or four) to the video, but you knew that!
Do you have a hot lap where you go into the pits? It would be interesting to see how much of the temp gradient across the tire you loose as the tire cools down. Can you post a pic of that zoomed in showing ony one tire so it is easier to see?
I've looked at that a bunch. The temps in the pits are basically the straight away temps. Mid corner temps will vary a lot based on how the tire is used. Spinning a tire and lots of slip angle will cause the temps to go up a lot. I worked with some of the Pirelli engineers on temps, wear, and performance in some of the DH slicks and they really like the IR data.
I realize that the tires cool quickly, I was wondering if the temp gradient accross the tire was still valuable if you use a temp probe at pit wall. In other words, if the IR shows a 20 degree from outside to center and another 20 degrees center to inner, is that going to show up simarly in pits (assuming you heep the tires working hard all the way to pits) even though max temp will have dropped 40-50 degrees. I'd like to see data on that.
I realize that the tires cool quickly, I was wondering if the temp gradient accross the tire was still valuable if you use a temp probe at pit wall. In other words, if the IR shows a 20 degree from outside to center and another 20 degrees center to inner, is that going to show up simarly in pits (assuming you heep the tires working hard all the way to pits) even though max temp will have dropped 40-50 degrees. I'd like to see data on that.
 06-13-2017, 11:49 AM