
Technical data on "flashes"
 08-10-2010, 05:04 PM
#46
Race Director

Kevin, quick question if I may, Toby didn't post my logs from the event, but would you think that 13.1/13.2/13.3 max is too high afr figures ?... this is what my X50+flash+milltek+headers is doing above 6500rpm to the redline in 4th and 5th... below that its 11.5- mid 12s typically.
I'm thinking it may be time to add a 5bar fpr?
I'm thinking it may be time to add a 5bar fpr?
On a high boost car, I'd want no more than 12.0, preferably 11.8.
I would not be running the car, datalogs or not.
Get it on a dyno
 08-15-2010, 01:20 AM
#47
Track Day

Join Date: Oct 2003
Posts: 22
Likes: 0
Received 0 Likes
on
0 Posts
TB993TT
Your thoughts on my numbers running E85 Protomotive Tune
Timing holds steady @17.25 under max boost 21+ psi and load 237.
Speed Load I angle I time Lamda Pressure AFR Boost
4369.75 189.66 18 21.24 0.85132 2260 12.514404 18.56
4455.5 199.29 17.25 21.7 0.80298 2340 11.803806 19.72
4575.25 209.04 17.25 22.18 0.7854 2400 11.54538 20.59
4693.75 219.38 17.25 22.91 0.77686 2450 11.419842 21.315
4859 230.53 17.25 23.99 0.78149 2470 11.487903 21.605
5003 237.05 17.25 24.09 0.76587 2430 11.258289 21.025
5106 229.64 17.25 21.79 0.72534 2350 10.662498 19.865
5115.5 220.22 17.25 20.3 0.72314 2260 10.630158 18.56
5157.75 208.92 17.25 18.86 0.72437 2150 10.648239 16.965
5099.75 197.88 17.25 18.58 0.76855 2090 11.297685 16.095
5114.5 188.41 17.25 18.43 0.79907 2080 11.746329 15.95
5086.25 184.45 18 18.36 0.81323 2100 11.954481 16.24
5145 182.98 18.75 17.13 0.771 2130 11.3337 16.675
5230 184.57 18.75 18.96 0.80957 2150 11.900679 16.965
5286.5 186.3 18 19.21 0.83911 2170 12.334917 17.255
5361.25 187.92 18 19.34 0.83667 2180 12.299049 17.4
5452.5 189.45 17.25 18.25 0.78833 2190 11.588451 17.545
5509 190.95 17.25 17.42 0.75854 2200 11.150538 17.69
5549.25 192.94 17.25 19.23 0.81299 2220 11.950953 17.98
5621.75 193.08 17.25 18.78 0.80371 2220 11.814537 17.98
5665 192.49 17.25 17.7 0.77002 2220 11.319294 17.98
5747 192.23 17.25 17.92 0.79297 2220 11.656659 17.98
5787 191.25 17.25 17.92 0.7981 2210 11.73207 17.835
08-15-2010, 09:21 AM
#48
Addict
Rennlist Member
Rennlist Member
Thread Starter
Thanks for sharing your data 
Please realise I am in no way an expert on this stuff, just a consumer like most on here.....
The numbers all look good to me but what I would say is that the numbers can be made to look like a 7 second dyno run, ie if the numbers you have shared were done in 3rd gear then there is not the load or the heat generated by properly loading the engine, just like on most chassis dynos.
I guess they do tell you that in that load and heat range all is good but they don't really paint the full picture do they ?
If you look at the numbers I originally posted it was only at the really high speeds that things started getting messy for some of the tunes....
I guess to truly demostrate a good system tune we need fully loaded up to 180+mph which I realise is pretty difficult for most ? And what is moot is that your data may well represent the range of load/temperatures where you drive the car most and it may not matter a jot to you if your numbers go wonky at higher speeds/loads/temps........
Could you confirm what gear/speeds the data is run at and also I do not really understand the "load" number, what exactly is that ? could you log the air mass kg/hr in future, this seems to be a good indicator of how much air and engine can burn....
 08-15-2010, 03:29 PM
#49
Addict
Rennlist Member
Rennlist
Site Sponsor
Rennlist Member
Rennlist
Site Sponsor
Toby you should "tick" the LOAD, that is the ECU calculating actual engine Torque. You can plot the cure and give you a direct image from a dyno sheet. It is VERY accurate. You can see the results when timing is being pulled. I know that you have used the air mass to see what the engine is doing. I'd prefer the LOAD.
To really see what the engine is doing one should start in 3rd gear and shift into 4th gear pull to redline and shift into 5th and run it as high as you can safely.
The only niggle that you guys should really check is injector duty. This will show if your injectors are maxed out.
To really see what the engine is doing one should start in 3rd gear and shift into 4th gear pull to redline and shift into 5th and run it as high as you can safely.
The only niggle that you guys should really check is injector duty. This will show if your injectors are maxed out.
08-15-2010, 04:18 PM
#50
Addict
Rennlist Member
Rennlist Member
Thread Starter
Toby you should "tick" the LOAD, that is the ECU calculating actual engine Torque. You can plot the cure and give you a direct image from a dyno sheet. It is VERY accurate. You can see the results when timing is being pulled. I know that you have used the air mass to see what the engine is doing. I'd prefer the LOAD. .
08-15-2010, 05:36 PM
#51
Addict
Rennlist Member
Rennlist
Site Sponsor
Rennlist Member
Rennlist
Site Sponsor
Toby the engine/ECU doesn't know the gear> however it does react to load and resistance. Please remember these ECU's are LOAD based. All calculations are based on Torque. Infact you can use your HP formula and graph your HP.
To get the reference number you will need to plot the load against "your" dyno sheet. The most accurate method is to grab the actual LOAD from a stock car, and lay that over the factory dyno sheet. That will give you the correct axis numbers.
Toby this type of bench racing is very accurate. Provided that we stipulate the gears. It is acutally more "telling" than a 60 to 130 run.
A third gear pull is similar to strapping the car on a Dynojet and doing a 5 second pull and reporting 800HP. The best pull is when the gear ratio is close to 1:1 which is usually 4th gear. In 5th gear we start seeing the engine PULL against the overdrive ratio.
08-20-2010, 09:16 PM
#52
Addict
Lifetime Rennlist
Member
Lifetime Rennlist
Member
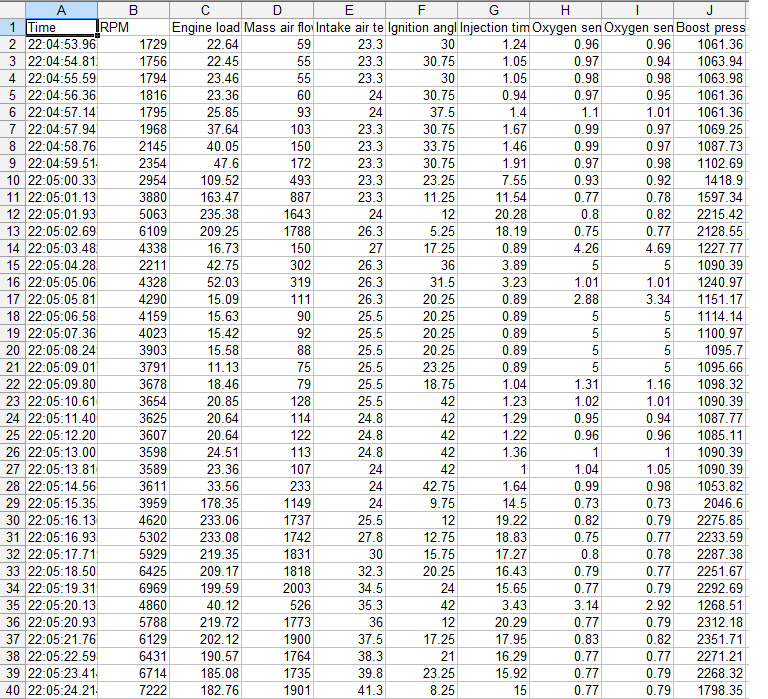
Kevin asked me to post some of my datalogs from my 996TT in this thread. I'm glad to add to the data that people can look at.
My car is a 2001 996TT with stock internals, airbox, injectors, fuel pump and intercoolers. It has Kevin's hybrid K16/997GT2 ZC turbos, Milltek exhaust with 100 cell cats, 5 bar FPR. Kevin tweaked his base tune for this package after I logged some similar data and the injector duty cycles were running a bit too high. This is what I am running on my car now. I logged these data back in April. This is a fourth gear pull on 93 octane. The first 12 columns are the parameters Kevin asked me to log. The last two columns are injector duty cycle and boost in bar, computed as follows:
Duty cycle (%) = (Inj time)*(RPM)/1200
Bar = (Boost @ sensor - ambient pressure)/980
I have also included below a plot of Engine Load vs RPM, and the corresponding HP. Both of these values are relative units because load is reported without units. It should be proportional to torque, but I don't know what the factor is. There are 4 consecutive pulls, showing the consistency of the results.
Hope this helps.
Jon
09-03-2010, 10:59 PM
#53
Intermediate

Join Date: Jun 2010
Posts: 30
Likes: 0
Received 0 Likes
on
0 Posts
10-07-2010, 08:09 AM
#54
Intermediate

Join Date: Jan 2008
Posts: 32
Likes: 0
Received 0 Likes
on
0 Posts
Kevin asked me to post some of my datalogs from my 996TT in this thread. I'm glad to add to the data that people can look at.
My car is a 2001 996TT with stock internals, airbox, injectors, fuel pump and intercoolers. It has Kevin's hybrid K16/997GT2 ZC turbos, Milltek exhaust with 100 cell cats, 5 bar FPR. Kevin tweaked his base tune for this package after I logged some similar data and the injector duty cycles were running a bit too high. This is what I am running on my car now. I logged these data back in April. This is a fourth gear pull on 93 octane. The first 12 columns are the parameters Kevin asked me to log. The last two columns are injector duty cycle and boost in bar, computed as follows:
Duty cycle (%) = (Inj time)*(RPM)/1200
Bar = (Boost @ sensor - ambient pressure)/980
I have also included below a plot of Engine Load vs RPM, and the corresponding HP. Both of these values are relative units because load is reported without units. It should be proportional to torque, but I don't know what the factor is. There are 4 consecutive pulls, showing the consistency of the results.
Hope this helps.
Jon
My car is a 2001 996TT with stock internals, airbox, injectors, fuel pump and intercoolers. It has Kevin's hybrid K16/997GT2 ZC turbos, Milltek exhaust with 100 cell cats, 5 bar FPR. Kevin tweaked his base tune for this package after I logged some similar data and the injector duty cycles were running a bit too high. This is what I am running on my car now. I logged these data back in April. This is a fourth gear pull on 93 octane. The first 12 columns are the parameters Kevin asked me to log. The last two columns are injector duty cycle and boost in bar, computed as follows:
Duty cycle (%) = (Inj time)*(RPM)/1200
Bar = (Boost @ sensor - ambient pressure)/980
I have also included below a plot of Engine Load vs RPM, and the corresponding HP. Both of these values are relative units because load is reported without units. It should be proportional to torque, but I don't know what the factor is. There are 4 consecutive pulls, showing the consistency of the results.
Hope this helps.
Jon
Its good that Kevin asks for so many tuned parameters to be logged, espec duty cycle, which seems to be often overlooked.
11-14-2010, 01:42 PM
#55
Intermediate
Join Date: Mar 2010
Location: Surrey UK
Posts: 40
Likes: 0
Received 0 Likes
on
0 Posts
Toby you should "tick" the LOAD, that is the ECU calculating actual engine Torque. You can plot the cure and give you a direct image from a dyno sheet. It is VERY accurate. You can see the results when timing is being pulled. I know that you have used the air mass to see what the engine is doing. I'd prefer the LOAD.
To really see what the engine is doing one should start in 3rd gear and shift into 4th gear pull to redline and shift into 5th and run it as high as you can safely.
The only niggle that you guys should really check is injector duty. This will show if your injectors are maxed out.
To really see what the engine is doing one should start in 3rd gear and shift into 4th gear pull to redline and shift into 5th and run it as high as you can safely.
The only niggle that you guys should really check is injector duty. This will show if your injectors are maxed out.
I just cannot see how load parameter or for that matter actual engine torque helps as you have suggested.
Load is affected by gradient. When I datalog the same gear but on different gradients the figure is higher the higher the gradient.
The actual engine tq is a percentage but I cannot see how this can be related between a modified car and a non modified.
I was able to attain a std 996tt datalog to see the values of load, actual engine tq and MAF. In fact whilst MAF does not in isolation provide all the answers to the power (since it is dependant on the tune keeping the AFRs good, IATs etc) it seems to me to be a strong indicator.
For example a std 996tt outputs on boost approx 1250kg/hr. So that is 420bhp. When I look at Toby's his MAF is around 1700kg/hr. If I look at a stage 1 map on the 996tt the MAF figure is around 1350-1400kg/hr. On my car it is at 0.8bar around 1350, 1.3bar 1950 and 1.5bar 2200kg/hr.
However looking at Actual Engine tq for those cars, there does not seem to be a great deal of difference.
In simple terms the MAF figure all other things being equal, seems quite a good indicator if the car is making the correct use of the airflow.
I looked at trying to overlay to the std factory dyno, but am no further on.
Ken
11-14-2010, 05:21 PM
#56
Addict
Rennlist Member
Rennlist
Site Sponsor
Rennlist Member
Rennlist
Site Sponsor
Ken, the Motronic is ALL load based. The stock 996TT MAF will quickly max out at 5volts and will not reach anything over 1400kg/hr.
Yes, grade plays an impact. The 60 to 130 runs the airstrip mile runs and VMAX events are run flat. You have to log in 4th and 5th gear to reach your maximum load.
Once you start to increase the power output with timing and boost your load also increases.
Here is a log.. You can see the load and airflow.
11-15-2010, 09:56 AM
#57
Intermediate
Join Date: Mar 2010
Location: Surrey UK
Posts: 40
Likes: 0
Received 0 Likes
on
0 Posts
Ken, the Motronic is ALL load based. The stock 996TT MAF will quickly max out at 5volts and will not reach anything over 1400kg/hr.
Yes, grade plays an impact. The 60 to 130 runs the airstrip mile runs and VMAX events are run flat. You have to log in 4th and 5th gear to reach your maximum load.
Once you start to increase the power output with timing and boost your load also increases.
Here is a log.. You can see the load and airflow.
Yes, grade plays an impact. The 60 to 130 runs the airstrip mile runs and VMAX events are run flat. You have to log in 4th and 5th gear to reach your maximum load.
Once you start to increase the power output with timing and boost your load also increases.
Here is a log.. You can see the load and airflow.
So I have attached a run done on a std 996tt with no modifications.
You can see that at top of 4th into 5th gear, the engine load was 150, Actual Engine tq was around 80, and the MAF was around 1275kg/hr.
I also have some data from another 996tt which has stage 1 map, exhaust etc.
The engine load was 165, (I don't have AET) and the MAF was around 1350kg/hr.
We know that the latter car is faster. In fact the reason is that it is an x50, so this is why it is flowing more air.
If I look at my car (full Protomotive 996tt with k24/20g) at just 0.8 bar of boost, it is has load of 211, aet of 94, with MAF of 1300.
In terms of performance, the Protomotive beats the X50 at 0.8 bar of boost hands down.
So the question is how can we derive the hp from this information. I ran my car at Bruntingthrope at 1.3 bar and ran 0-300kph in 23.8 seconds. So I know that it has 750hp at 1.3 bar because of the time.
What I was trying to acheive is a way other than as you say 60-130 times of accurately assessing different cars based on load, AET & MAF.
Regards Ken
BTW my car has a FORD MAF so doesn't have the same restrictions.
11-15-2010, 05:27 PM
#58
Addict
Rennlist Member
Rennlist
Site Sponsor
Rennlist Member
Rennlist
Site Sponsor
Your load calculations with the Ford MAF are going to be different from a STOCK 996TT. I assume that you are also running a EBC..
Engine timing and actual boost needs to be included to show what is Apples to Apples..
Engine timing and actual boost needs to be included to show what is Apples to Apples..
11-16-2010, 06:41 PM
#59
Intermediate
Join Date: Mar 2010
Location: Surrey UK
Posts: 40
Likes: 0
Received 0 Likes
on
0 Posts
I send you an email to progress on this.
Ken