
1 mile acceleration testing 997GT2
 10-20-2009 | 07:42 PM
#16

Racer
Joined: Oct 2005
Posts: 477
Likes: 0
From: Oceania
TB -- the cars at approx the 200 mark that achieved roughly 20 sec to 186(300) are definately daily drivers. BMoores car is not that heavily modified-but is obviously working very well -even given the fall shown .
The point I was really getting at that some of the "dyno" claims are very roughly falling in line with achieved times and in a direct comparison to your times and HP.
Take off 10% off US dyno numbers and the numbers are consistent-what do you think?
Any way I look at all these performances equals the extraordinary.
Last edited by Red9; 10-21-2009 at 02:51 AM.
10-21-2009 | 01:38 AM
#17
Drifting
Joined: Nov 2005
Posts: 2,284
Likes: 1
From: NY, LI
Excellent timing TB. Two continents -very similar events on the same weekend.
The Texas event saw a 996TT time for 0-300kmh in the 14's(231mph)-- quite incredible .
A number of others achieved times of 20.23 and 21.03 .That would be consistent with your stated HP and equivelent time of 25's.With about 200 mph approx that figure would also seem consistent.
The Texas event saw a 996TT time for 0-300kmh in the 14's(231mph)-- quite incredible .
A number of others achieved times of 20.23 and 21.03 .That would be consistent with your stated HP and equivelent time of 25's.With about 200 mph approx that figure would also seem consistent.
Fast as hell none the less, and your car is looking SICK
 10-21-2009 | 05:48 AM
#18
Thread Starter
Addict
Rennlist Member
Rennlist Member
Joined: May 2001
Posts: 4,446
Likes: 115
From: UK
TB -- the cars at approx the 200 mark that achieved roughly 20 sec to 186(300) are definately daily drivers. BMoores car is not that heavily modified-but is obviously working very well -even given the fall shown .
The point I was really getting at that some of the "dyno" claims are very roughly falling in line with achieved times and in a direct comparison to your times and HP.
Take off 10% off US dyno numbers and the numbers are consistent-what do you think?
Any way I look at all these performances equals the extraordinary.
The point I was really getting at that some of the "dyno" claims are very roughly falling in line with achieved times and in a direct comparison to your times and HP.
Take off 10% off US dyno numbers and the numbers are consistent-what do you think?
Any way I look at all these performances equals the extraordinary.
 and the 7GT2s big downforce aero which slows it up big time over 200kph blurs the hp picture...
Suffice to say these Texas guys stepped up and showed their mettle and it is impressive
 10-21-2009 | 12:18 PM
#19
Rennlist Member
Joined: Jun 2007
Posts: 3,256
Likes: 363
From: Dallas, TX
IMHO, I think this is still effectively flat. It doesn't seem like it would give much of an advantage to a car vs. one running on a 0% slope over such a long distance.
10-21-2009 | 01:31 PM
#20
Racer
Joined: Aug 2006
Posts: 424
Likes: 0
From: London UK
Not sure if you have seen it but I was just emailed this by Cargraphic, it is the article (in German) and results from the SportAuto 0-300 event:
http://www.cargraphic.de/stepone/dat...tAuto_1009.pdf
Amazing results you got well done, I quite fancy a GT2 now!
For reference:
Techart GT Street RS: 26.4
Ruf RT12: 27.3
LP670SV: 29.7
911 Turbo: 41.9
GT3: 50.3
The only cars faster than your GT2 were:
Geiger Ford GT: 22.8
Cargraphic GT RSC: 23.8 (lightened stripped out)
Konigsegg CCX-R: 24.7
10-21-2009 | 03:07 PM
#21
Rennlist Member
Joined: Aug 2001
Posts: 1,390
Likes: 157
From: Charleston SC
Very cool. 190 in the standing mile is very fast! We ran our 997 cup in the standing mile event in Maxton NC a few weeks ago. I set a record for the class we were in at 172.44. It was for NA engines 3.0 to 4.0l. A lot of fun. The Maxton guys will not let you run over 180 without a parachute and wont allow over 140 without a full roll cage and supporting safety equipment.
10-21-2009 | 03:58 PM
#22
Addict
Lifetime Rennlist
Member
Lifetime Rennlist
Member
Joined: Apr 2002
Posts: 5,452
Likes: 179
Godd info TB
I personally think the slope at the Texas Mile is acceptable given other parameters that can impact more the outcome between locations...wind , height, temps, surface drag, etc.. No doubt that Joe's car is insanely fast however, none of the above would have made a big difference to the acceleration numbers.
What is surprising is that no one seems to be paying enough attention to aerodynamics, not only drag but downforce. A 997GT2 has a huge handicap vs a 996TT when it comes to high speed runs, at 300kph the handicap is certainly not far from 600lbs more weight on the car..And your aggressive offsets and fat tires don't help with the CDA and rolling resistence.
Of course, you will never match a well prepared 996 running 2 bar of boost or more, it simply is impossible.
Thanks for the data, woudl be interesting to overlay your 993TT data
10-21-2009 | 06:51 PM
#23
Racer
Joined: Oct 2005
Posts: 477
Likes: 0
From: Oceania
The aero issue will only be considered now I think. Most of the guys running are relatively new to any form of competition-let alone getting real measurement. The 2 guys posting here (TB & Jean) are virtually responsible for creating(forcing?!!) interest in getting some real data other than a 1/4 mile & trap speed time and what interest it has created.
60-130 & 0-300 times are universal worldwide measures that by and large take away the variables and give a much more accurate measure of HP numbers than Dyno claims.I would have to say also--every dyno number now quoted is examined and analysed-thanks in a major part to the awareness that the two of you led into the consciousness!
One of the really interesting points is that a lot of money has been spent by some to go less than 5mph faster than a K16 car(AMS) - bigger difference in how quick it was getting there.
TB -were you collecting Intercooler data on your runs? How long between runs?
 10-24-2009 | 07:29 AM
#26
Thread Starter
Addict
Rennlist Member
Rennlist Member
Joined: May 2001
Posts: 4,446
Likes: 115
From: UK
OK guys so the slope at 0.7% is not a slope ? mmmm I am going to try and find such a slope and do a 60-130 on it and compare with flat. I guess like Jean said the aero and wind have a much greater influence at these speeds...
Coryf
The various safety measures at events such as these seem to vary a lot. For the vmax we do there is virtually zero formal safety, no helmets passenger rides no problem and a long enough stretch ~1.6miles to get up to 195+speeds with a braking distance which is way too short..... This event was IMO about right for safety, scruiteneering, lots of marshalling, helmets and a long braking distance - so long that I kept going after the mile up to 194mph
Red
Because the marshals checked the interiors of the cars before each run it was hard to rig up the computer with Durametric...... my solution was to keep going round and round and round until everyone else had lost interest and gone home so the marshals just waved me through last time with computer rigged up and logging !
Basically 13degC ambient the maximum IAT was 38.5degC at about 180mph then it started dropping slowly to be 36degC by 190mph - so the big airflow doing its thing.
Yearone
With 0-300s so much depends on the track - I would say that any car with logs between 24s and 28s in any test is probably very similar, only a back to back on the day can tell you...
MOD
it was the 29mpg on the way home which really blows you away !
Coryf
The various safety measures at events such as these seem to vary a lot. For the vmax we do there is virtually zero formal safety, no helmets passenger rides no problem and a long enough stretch ~1.6miles to get up to 195+speeds with a braking distance which is way too short..... This event was IMO about right for safety, scruiteneering, lots of marshalling, helmets and a long braking distance - so long that I kept going after the mile up to 194mph
Red
Because the marshals checked the interiors of the cars before each run it was hard to rig up the computer with Durametric...... my solution was to keep going round and round and round until everyone else had lost interest and gone home so the marshals just waved me through
last time with computer rigged up and logging !Basically 13degC ambient the maximum IAT was 38.5degC at about 180mph then it started dropping slowly to be 36degC by 190mph - so the big airflow doing its thing.
Yearone
With 0-300s so much depends on the track - I would say that any car with logs between 24s and 28s in any test is probably very similar, only a back to back on the day can tell you...
MOD
it was the 29mpg on the way home which really blows you away !
10-28-2009 | 08:22 AM
#27
Thread Starter
Addict
Rennlist Member
Rennlist Member
Joined: May 2001
Posts: 4,446
Likes: 115
From: UK
Was doing some reading following Jean's post to see what the various areodynamic data was available for these cars and how it may affect the acceleration at very high speeds (putting it here so I can refer back)
996tt
Measured Cd 0.295
Measured CdA 0.58
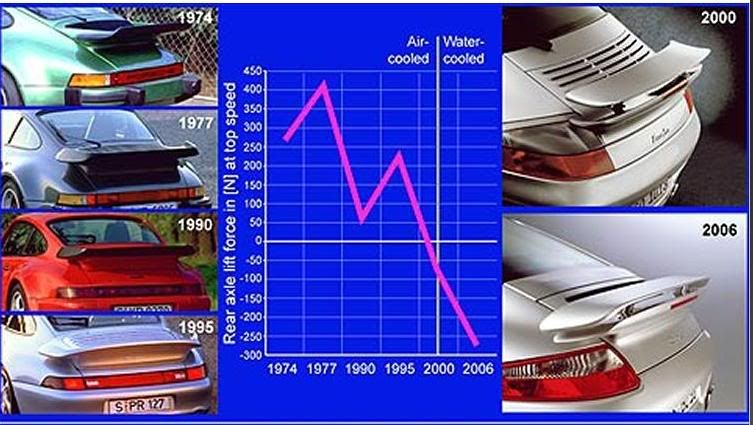
Lift at 200kph: f -6kg r +6kg
Downforce at rear maximum speed: 7.5kg (diagram below)
996GT2
Measured Cd 0.31
Measured CdA 0.61
Downforce at 200kph: f 2.2kg r 7.5kg
Downforce at 300kph: f 5kg r 17kg
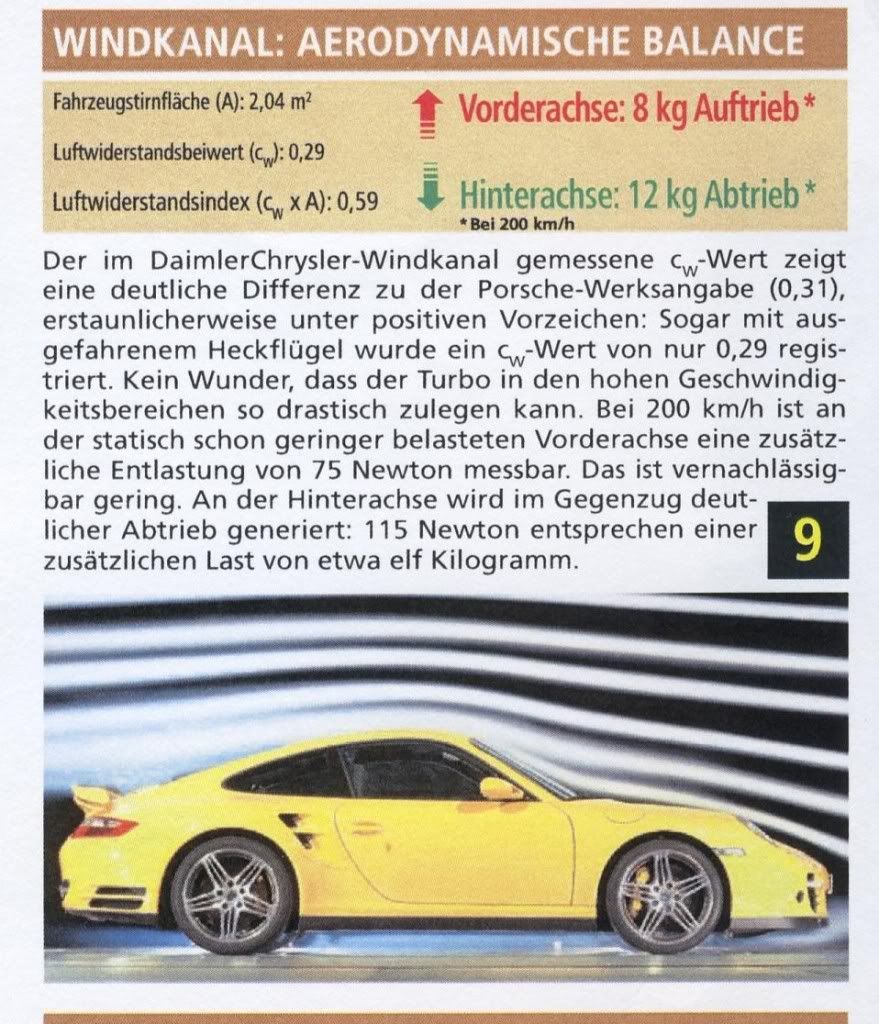
997tt
Measured Cd 0.29
Measred CdA 0.59
Downforce at 200kph: f -8kg r 12kg
Downforce at maximum speed 27.5kg (as per diagram above)
997GT2
Measured Cd 0.32
Measured CdA 0.66
Downforce at 200kph: f 9kg r 29kg
Downforce at 300kph (extrapolated): f 20kg r 66kg
I can grasp the downforce acting as extra weight for acceleration numbing purposes at high speed but can someone explain to me how the CdA affects the high speed acceleration. ie if a 997GT2 had the same downforce/lift as a 996tt but existing CdA, how would indentically powered cars accelerate at the top end ? are there any simplish formulas to demonstrate ?
996tt
Measured Cd 0.295
Measured CdA 0.58
Lift at 200kph: f -6kg r +6kg
Downforce at rear maximum speed: 7.5kg (diagram below)
996GT2
Measured Cd 0.31
Measured CdA 0.61
Downforce at 200kph: f 2.2kg r 7.5kg
Downforce at 300kph: f 5kg r 17kg
997tt
Measured Cd 0.29
Measred CdA 0.59
Downforce at 200kph: f -8kg r 12kg
Downforce at maximum speed 27.5kg (as per diagram above)
997GT2
Measured Cd 0.32
Measured CdA 0.66
Downforce at 200kph: f 9kg r 29kg
Downforce at 300kph (extrapolated): f 20kg r 66kg
I can grasp the downforce acting as extra weight for acceleration numbing purposes at high speed but can someone explain to me how the CdA affects the high speed acceleration. ie if a 997GT2 had the same downforce/lift as a 996tt but existing CdA, how would indentically powered cars accelerate at the top end ? are there any simplish formulas to demonstrate ?
10-28-2009 | 11:19 AM
#29
Thread Starter
Addict
Rennlist Member
Rennlist Member
Joined: May 2001
Posts: 4,446
Likes: 115
From: UK
All my "measured" numbers of from the independant windtunnel tests done by SA magazine which I tend to believe over manufacturers: