When you click on links to various merchants on this site and make a purchase, this can result in this site earning a commission. Affiliate programs and affiliations include, but are not limited to, the eBay Partner Network.
Car - 991.2 S with Powerkit
Transmission - PDK
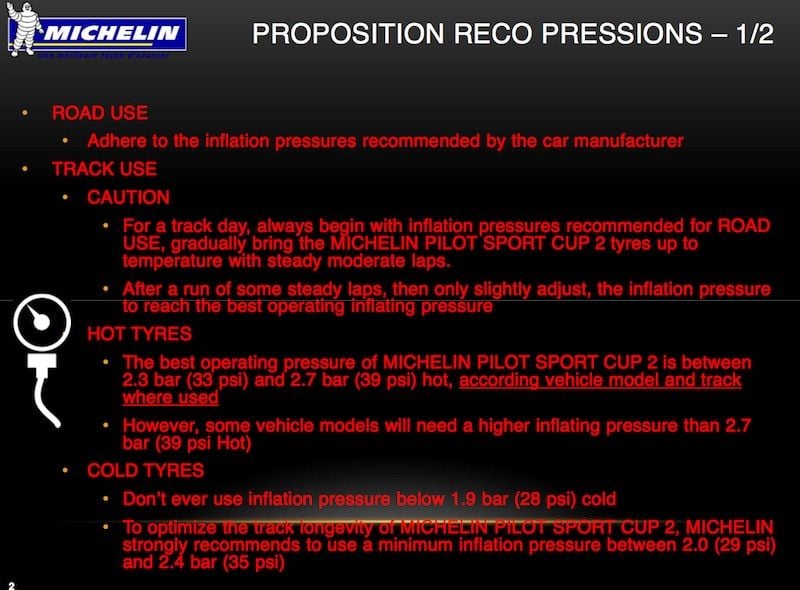
Tires - MPSC2 N1
Time - early evening
Temp - 27.5C to 29.5C
SC - Sports Plus
Weight - 1538KG with full fuel tank
Track - condition, greasy due to humidity, sand and drift rubber debris
Data source - 1Hz Sports Chrono (1 reading of all variables per second)
Data reliability - data edited off-line to remove knocks and erroneous GPS readings (n = 764).
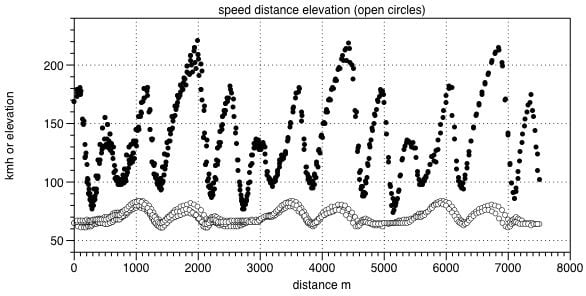
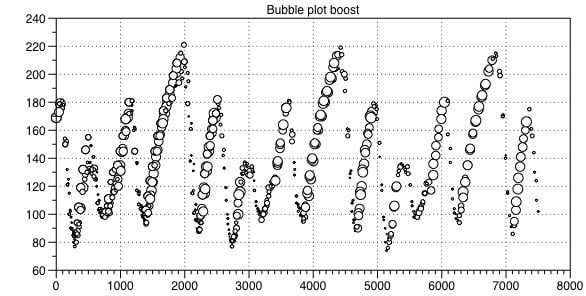
Figure 1 (above) - Graph of distance Vs speed (y - axis) and distance Vs elevation. VMax 225 kmh
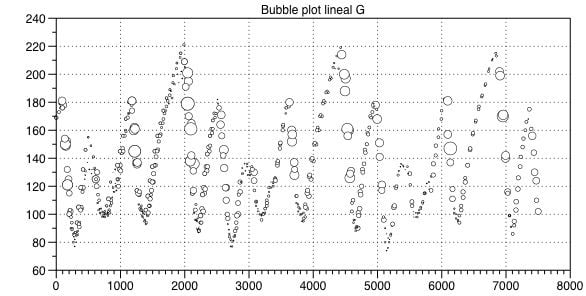
Figure 2 (above) - Graph of distance Vs speed. The bubble size represents lineal G (braking) - Max lin G ~ 1.4
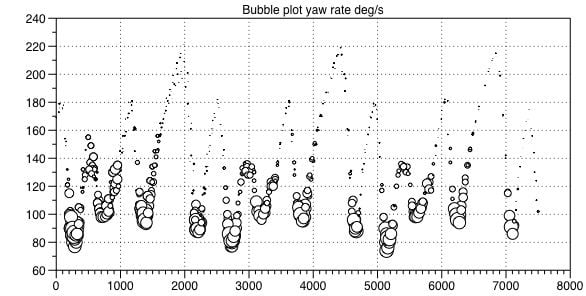
Figure 3 (above) - Graph of distance Vs speed. The bubble size represents yaw rate (twist) - peak cornering
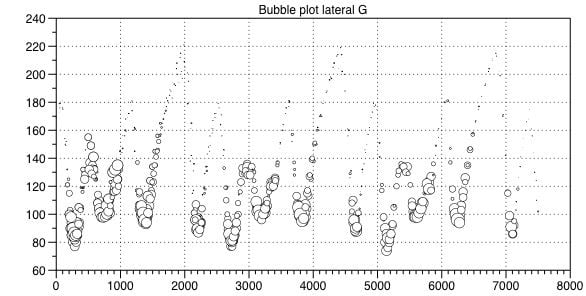
Figure 4 (above) - Graph of distance Vs speed. The bubble size represents lateral G (cornering and transitions) - Max lat G ~ 1.4
Figure 5 (above) - Graph of distance Vs speed. The bubble size represents boost pressure (hard acceleration out of corners).
I'm currently uploading graphs to the site - so give me 30mins
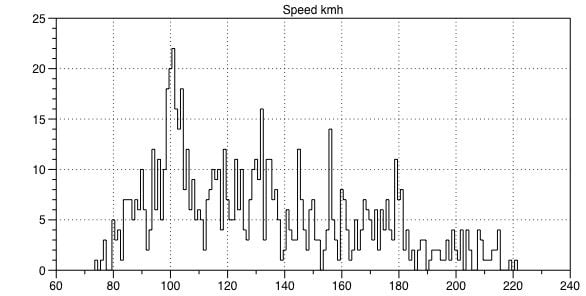
Histograms of a number of performance variables and controls on performance
Figure 9 (above) Histogram of speed - kmh x - axis bins and number of measurements y - axis
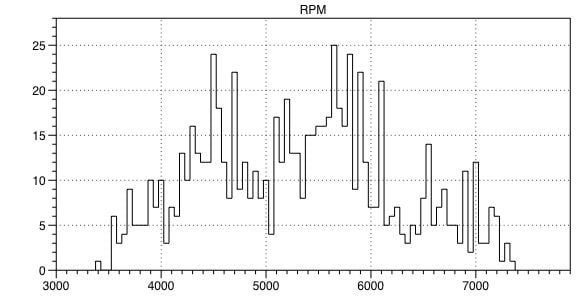
Figure 10 (above) histogram of RPM - x - axis bins and number of measurements y - axis. Sports plus holds the engine above 3500 RPM and below 7500rpm.
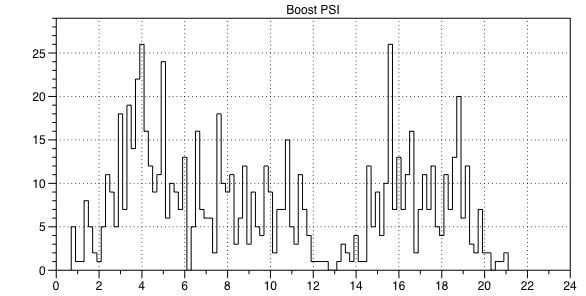
Figure 11 (above) histogram of boost pressure PSI - x - axis bins and number of measurements y - axis. Boost is routinely above 18PSI and up to 21 PSI. Boost rarely drops below 2PSI.
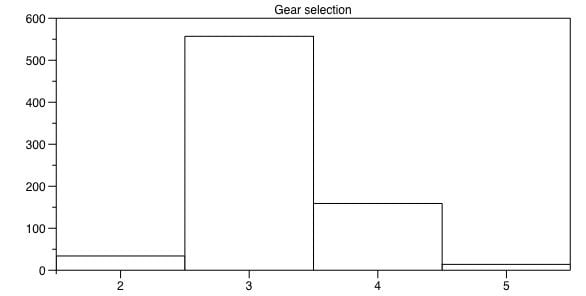
Figure 12 (above) PDK gear selection - this track is a three four track
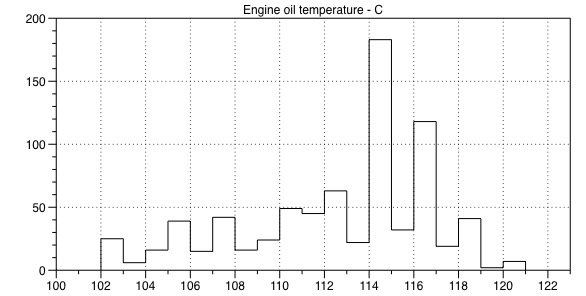
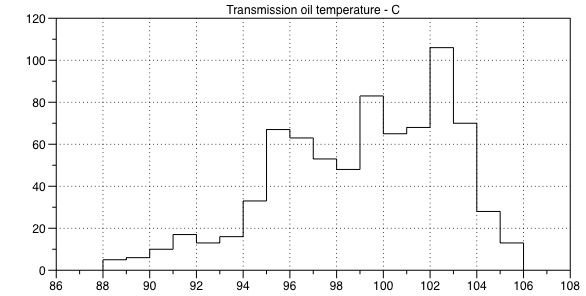
Engine oil and transmission oil temperatures (water temperature does not budge from 90 degrees C)
Figure 13 (above) Engine oil temperatures - degrees C (x axis bins temperature degrees C, y - axis number of data points). Note typical oil temperatures during daily driving range from 90C (sport mode on) to 107C (sport mode off)
Figure 14 (above) Transmission oil temperatures - degrees C.
Graphs pertinent to tire performance - note comments in section 1 e.g. nightime driving and "greasy" surface
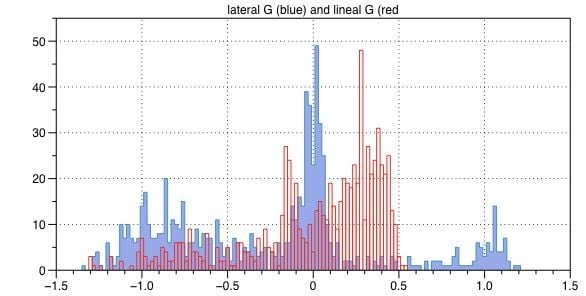
Figure 15 (above) lateral g (blue - cornering) lineal g (red - braking). Note the maximum negative lineal g is the same as the maximum (RHT) lateral g. This implies the grip limits are close to the tires maximum under the conditions outlined above.
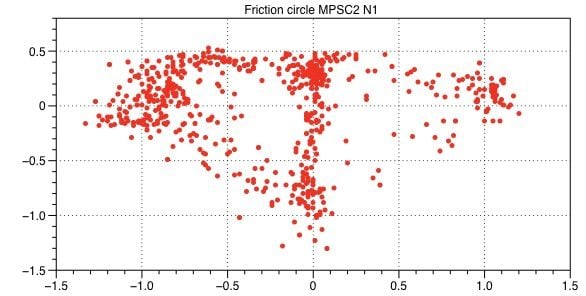
Figure 16 (above) Conventional friction circle for MPSC2 N1 (RHT = W, LHT = E, acceleration = N, braking = S). New tires with around 1000kms of light scrubbing. Temperatures as per Michelins recommendations (see below).
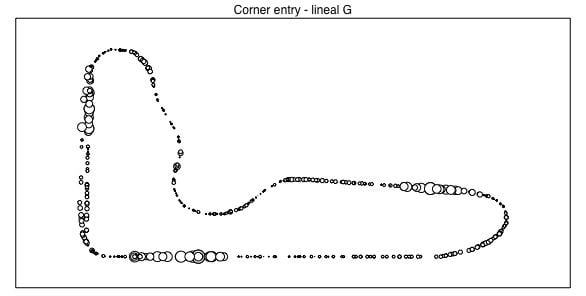
Geographic representations of data highlighting transitions, braking, cornering and exit
Figure 6 (above) Bubbles represent lineal G (braking)
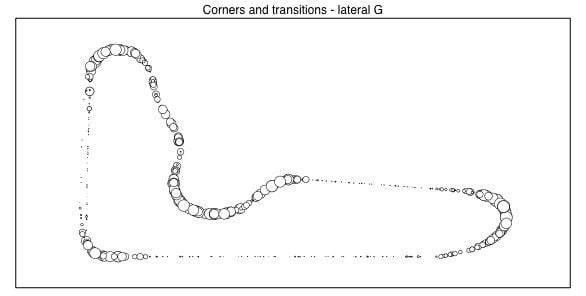
Figure 7 (above) Bubbles represent lateral G (cornering), zones of "necking" represent weight transition from left to right or right to left
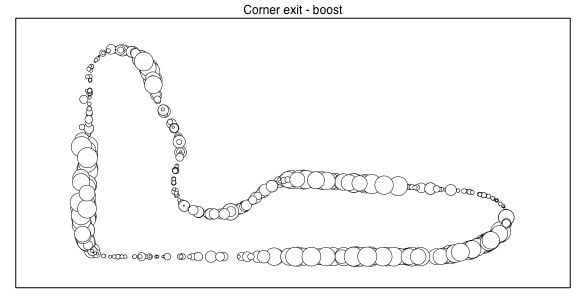
Figure 8 (above) Bubbles represent boost, hard acceleration out of corners
This last one (Fig 8) is really useful and shows something I've noticed is very common on the videos people post, but is always met with skepticism because, not in the car, so what do I know? (PCA Driver Ed, Autocross, and Driver Skills Instructor. I know.)
The size of the bubbles shows a car on full boost really early in the turns. Not even coming out of the turns, sometimes even before the apex. (Would be helpful to label turns T1, T2, etc.)
A car only has so much traction. With that traction you can maximize braking, turning, or accelerating- but not all at once. So getting on the throttle early sacrifices cornering and is actually slower. Even though it might feel fast, it is not. The fastest driver is cornering so damn hard through so much of the turn he's max'd out on traction with nothing left to accelerate with until well past the apex.
Cars like the 991 are really good at hiding this from you. If you tried the technique in Fig 8 with earlier 911's you would simply push right off the track. But the 991 senses your steering input, prioritizes that over throttle (safety, liability) and applies braking to your inside rear wheel, trying to make the car corner, countering your throttle input which would otherwise push you off to the outside.
Lots of guys complain about excessive REAR brake pad wear on the track. Here we have a visual demonstration and explanation of exactly why this happens.
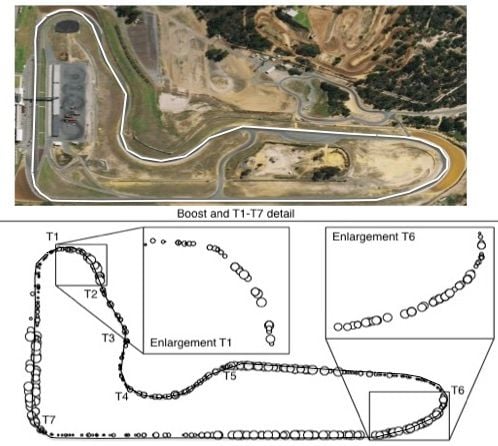
Upper figure, aerial photo of track with race line marked in white
Lower figure, data plot with bubbles representing boost, race line marked in black - I have enlarged T1 (mid to exit) and T7 (mid to exit)
T1 - flying entry dropping from ~ 190kmh to 80kmh, right hander opening out with late apex and line up entry for T2, T3 and T4.
T2-T3 is treated as a straight with three transitions taken at ~ 160kmh, dab brakes into T4 (this section is very tricky and has claimed many RE and ME cars due to the high speed transitions being coincident with undulations in the track).
T4 left hander uphill into blind T5 - the transition into T5 is uphill and you cant see the corner. You take T4 at about 110kmh and shoot through T5 at about 145kmh (night time, blind corner over crest on greasy track at close to 100mph ).
T5 to T6 is a short fast downhill straight with an elevation drop greater than the cork screw, by the end of the straight you are at 190kmh - T6 is a right hander opening out with a late apex into an uphill straight.
You hug the outer portion of the corner and line up for the late apex and straight, as soon as you can see the exit line opening, you hit the hammer and keep the foot to the floor to VMax on the straight at 225kmh as you approach, downhill, a 90 degree right hander at T7. Very hard late braking or the sand is your friend - and through to the finish line midway between T7 and T1
If you have a look at the enlargements you will see the boost is further kicking in on cue for T1 and T6 e.g. when you have good sight to the straights.
If you have a look at the NW quadrant of the friction circle there is a strong outward arc from ~ -1.4g (right hand corners) to +0.5 lineal g (pure acceleration). This represents acceleration out of the right hand corners. Note, the maximum negative lineal g (braking) is about the same - basically I'm at the limit of the grip the tires have to offer under the conditions encountered at the time
The place where I was "slow" was through sector T2-T3 (see the lat g bubble plot - not working the tires to their limit) - wasn't willing to chance my arm at night with a slightly greasy track (has claimed many mid and rear engined cars).
I love data. You've got great data. I love good data analysis even better. Nicely done! Thanks for posting this.
So a question that popped up on another thread for those of us just getting the Track Precision app up and running, there are reports of the performance of the app not being solid. It appears that you used that for the capture here, right? If so, how did it work for you? You mentioned data clean-up for example.
I ask even though I personally don't expect to do at-the-edge tracking like you are doing here I like to understand the tools and data that are available. I do autocross aggressively though and while I imagine Harry's Lap Timer is still better at this since it has a specific autocross mode, I'd be curious to see what data I can grab using the Porsche app that might be useful for that. My only disappointment with Harry's in autocross is that the automatic lap video start drops the first few seconds of video despite the 10hz capture rate it achieves with the right OBD-II reader and GPS add-on.
Now with the enlargement it looks like spotty readings from several laps superimposed all into one. Which (if that's what it is) then you make one mistake on one lap, it makes the whole graph look bad. Is that what it is? How many laps are we looking at here?
Now with the enlargement it looks like spotty readings from several laps superimposed all into one. Which (if that's what it is) then you make one mistake on one lap, it makes the whole graph look bad. Is that what it is? How many laps are we looking at here?
Chuck - that would be three laps of 1Hz data (superimposed - in the geographic plots).
Originally Posted by StormRune
So a question that popped up on another thread for those of us just getting the Track Precision app up and running, there are reports of the performance of the app not being solid. It appears that you used that for the capture here, right? If so, how did it work for you? You mentioned data clean-up for example.
Storm - I use the Porsche Sports Chrono system - its very straightforward to use. Its is displayed via a menu in the gauge cluster and the track appears on the PCM display (car button- options button - SC). I have reference laps for a number of tracks and drive against the reference laps. In the cluster display, the timing band goes red if you're down relative the reference lap, amber if you're just behind and green if you're ahead. Same as the ghost driver principle. Its a good system.
When the day is done, I transfer the data via the PCM to a USB stick. The files are CSV format but are in actual fact semicolon separated value files . Open a new worksheet in excel, select import CSV, highlight the file - hit import, a dialogue box will appear. Start import from row 2, then import as a tab and semi colon delimited file and the data imports correctly into excel.
The data clean up is simple, I identify data such as downtime in pits, red flag laps, cool down laps and knocks. Knock events are odd data points caused by hitting rumble strips hard, losing the back end etc. I delete these to deliver "clean" data for analysis. To plot data I use a piece of software called data graph (fast and efficient).
I also use HLT, its simple and effective - I have zero luck with the track precision app largely because my 911 wifi module is dead - the dealer is looking into it.
As you probably realise there are lots of other systems you can buy that provide analysis tools and high frequency GPS receivers

 02-06-2018, 03:57 AM