When you click on links to various merchants on this site and make a purchase, this can result in this site earning a commission. Affiliate programs and affiliations include, but are not limited to, the eBay Partner Network.
Does anyone have the relationship between the SharkTuner's fuel map load axis numbers and the actual KG/Hr? Or, a relationship between the SharkTuner fuel map load axis and voltage (which I could then translate into KG/Hr if I have the MAF flow tested)?
The Sharktuner uses a load axis for the stock MAF of 36 to 516. Which seems like it's kind of close to the G/Sec for the corresponding power output, but not close enough to think that's what it is.
Confusing the matter more is the SuperMAF map is 30 to 236, which doesn't seem to be close to any standard of measurement that I can discern.
I especially need this for the SuperMAF, but I would like it for the regular MAF as well.
Being able to convert those axis numbers into KG/Hr would make it a lot easier to convert the fuel and ignition maps. The SharkTuner documentation says that the regular MAF value of 516 is 6.1v, which I could work backward from. A last resort. The document also says that the SuperMAF has a maximum value of 7.5v, but it says that the upper range is "compressed". No linear scale will work there.
I'm sure that it can all be discerned from reading the bin files directly, but I'm hoping that someone already has the conversions before I have to dig into the hex coding.
I have flow data for both the stock and SMAF, sent it out myself a years ago for the same reason.
I do not have the correlation between the arbitrary load value in ST versus voltage through. That may be something that can be requested by the developers or something that can be logged and then extrapolated from several samples.
If you need it, shoot me an email and I will dig through my old files.
I've been told that the fuel map which can be altered in Sharktuner is only a fine tuning map.
I've been told that there is a "base" map operating in the background.
Jim Corenman?
I have flow data for both the stock and SMAF, sent it out myself a years ago for the same reason.
I do not have the correlation between the arbitrary load value in ST versus voltage through. That may be something that can be requested by the developers or something that can be logged and then extrapolated from several samples.
If you need it, shoot me an email and I will dig through my old files.
Hans, you're the man! Thank you. I'll send you an email shortly. The transfer functions would help a lot!
I considered the logging route, but I have no logs from the regular MAF, and I typically don't log MAF voltage so I don't have any useful SuperMAF logs either. Between the hassle of logging with the SharkTuner and the current snow and ice, I doubt if I'll be able to get any logs for awhile.
I'll also start looking into the hex code and seeing if I can figure out where the maps are. Given how common the LH was on Volvos, there is probably a tool or information in that realm.
Once I develop my conclusions, I'll post the findings along with a stock map translation. Assuming that I can get that far.
Originally Posted by GregBBRD
I've been told that the fuel map which can be altered in Sharktuner is only a fine tuning map.
I've been told that there is a "base" map operating in the background.
Jim Corenman?
You're correct. The +/- 127 is just a fuel adjustment based off of the "Primary load map". As for what the numbers on the primary load map mean...who knows. Possibly grams per minute? That's the best approximation that I come up with.
Idling in the 700x120 cell, the primary load map says that's 8,997. MAF value of 115. If we assume that 8,997 is in grams per minute...
8,897 grams per minute x 60 minutes per hour = 539,820 grams per hour = 540 Kg/Hr
(540 Kg/Hr / 2.02) / 1.6 = 167 HP
167 seems way too high for idling, but at least it's in the ball park. I have a -57 in that cell for my base fuel map, so maybe that makes up the difference? I think that the +/- 127 translates to +/- 25% of the calculated fuel delivery. -57 would then be -11%. No idea how that really translates into fuel consumption versus air requirements vs. available power, etc. Too many unknowns to invest time in putting the calculations together at this point.
Anyway, the "Primary load map" is exposed as one of the SharkTuner fuel maps. Here's a screenshot of it for the SuperMAF:
Closing the loop on this. Through analysis and logging, I've determined that the "Primary load map" is in Grams per Minute.
The SuperMAF load axis numbers are in Hectograms per Hour.
The ignition map load axis is in percentage of maximum MAF flow at maximum RPM, scaled by the "Engine load axis scale" on the "Ignition parameters" page.
That provides a viable path for converting the fuel and ignition maps to other formats, which I have done for my maps.
Here are some pretty pictures
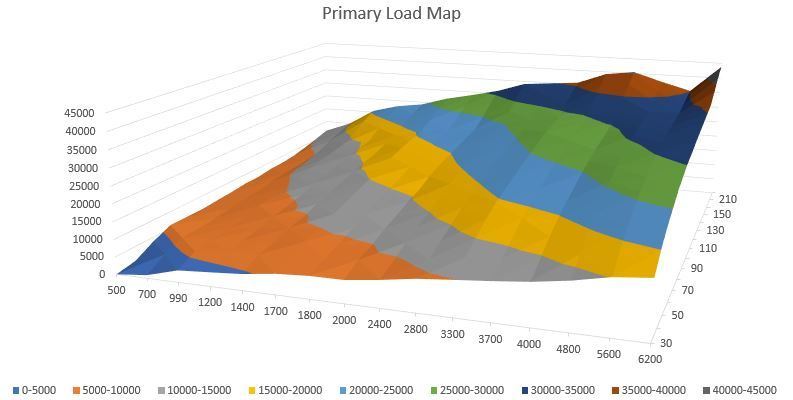
The Primary Load Map in 3D (Notice that big peak in the top right hand corner? That's why you have to pull so much fuel out on that last cell.):
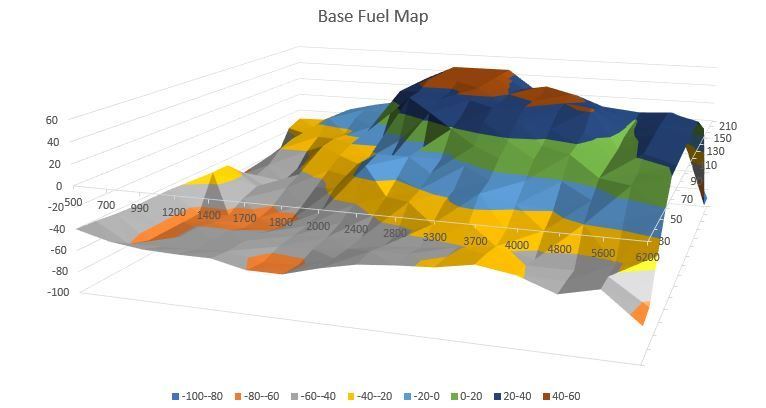
And my cruise fuel map (Notice how ugly and choppy it looks? This map gives me a very smooth AFR map in the real world logging.):
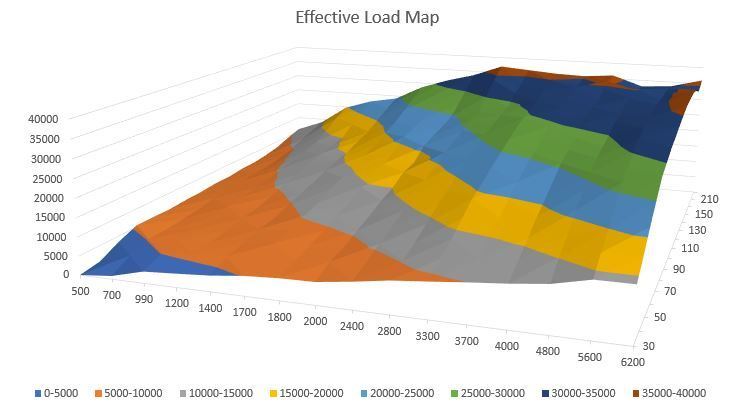
And the combined load/cruise effective fuel map (Notice how much smoother they are when combined? That's the fuel that's really being delivered.):
My conclusion is that while the resulting fuel map should be smooth, you can't always get there with a smooth cruise map in the SharkTuner, because the primary load map isn't flat or particularly smooth itself.


 01-16-2022 | 02:45 PM