When you click on links to various merchants on this site and make a purchase, this can result in this site earning a commission. Affiliate programs and affiliations include, but are not limited to, the eBay Partner Network.
I am using a SoloDL with SCHD.
At an event this weekend, I noticed the Channel report shows a -1.56 min GPS Lat_acc, while the min value I could find on the track report was about -1.2. Lastly, the min is about 1.0g on the SCHD overlay. Why is this? How do I find the min ooint on the track map if the data does not correlate?
The only explanation I have is that perhaps for each report the GPS lat_acc is averaged and the time constants of the averaging differ with track report using a longer time constant than channel report and SCHD overlay using an even longer time constant.
I think I've figured it out.
I have now correlated the data from channel report and track report - they now match. Not sure what I was doing wrong. The SCHD definitely appears to use a 'slower' average.
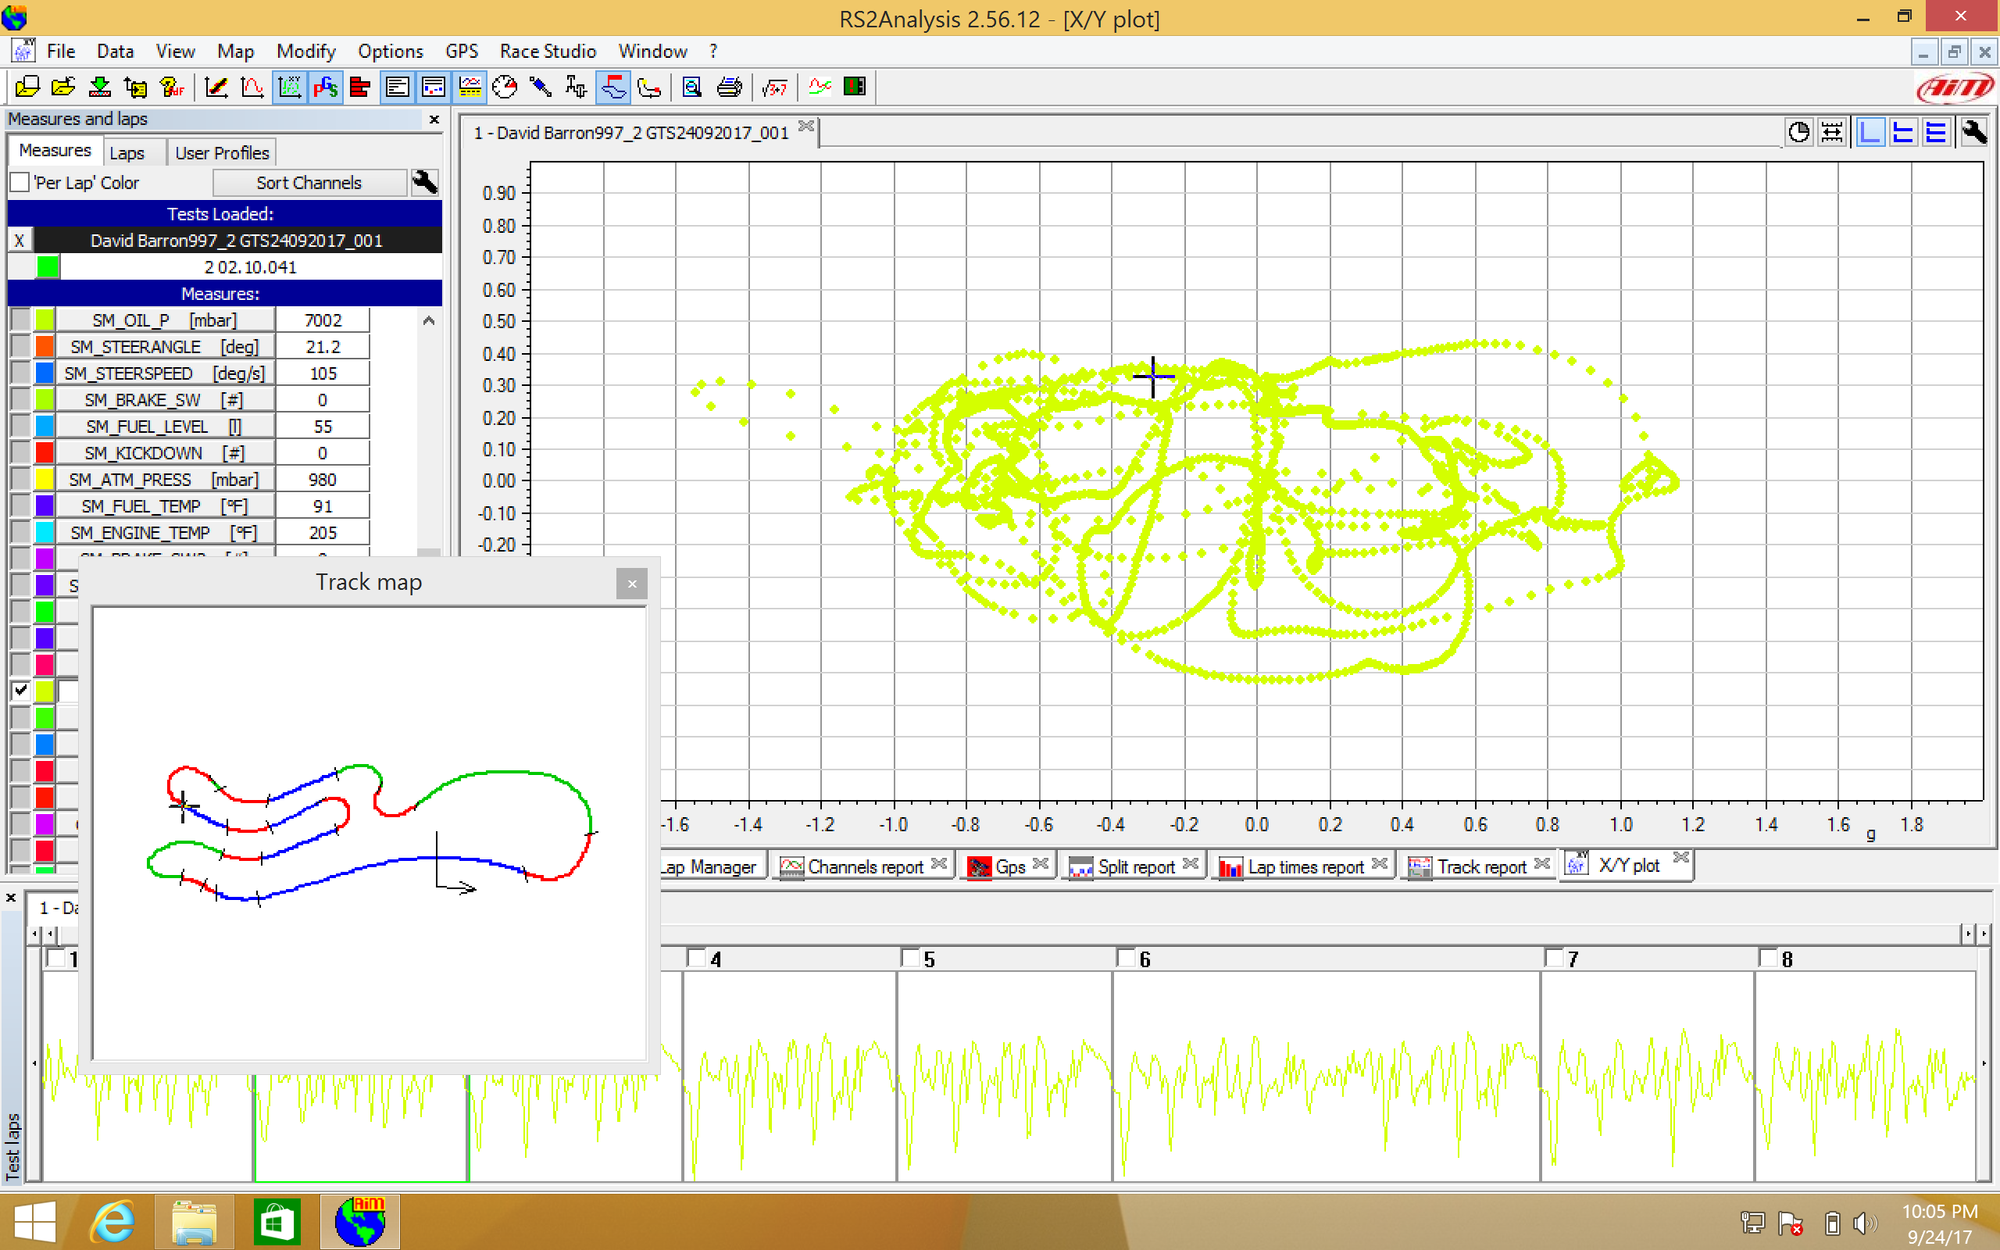
The anomolous point at issue is a left hander apex at a null in the track (bottom of dip) where the compression allows one to get some extra turn in and throttle - that's the upper left lat_acc peak I'm seeing in the XY plot attached.
 09-24-2017, 10:02 PM