When you click on links to various merchants on this site and make a purchase, this can result in this site earning a commission. Affiliate programs and affiliations include, but are not limited to, the eBay Partner Network.
So I have been experimenting around with looking to visualize understeer/oversteer to independently confirm my butt feel. For this type of analysis I can highly recommend Graham Templeman's book "The Competion Car Data Logging Manual" which is available on iTunes.
Graham's theoretical steering angle formula with the correct units plus the wheelbase of my 2012 Cayman is:
This allows you to calculate the THEORETICAL front wheel steering angle that you would achieve at very slow speeds.
In order to determine the ACTUAL steering angle, I have used data from a slow speed outlap and scaled my steering sensor data to superimpose on top of the theoretical steering angle from the formula above. (In my case, I divided my steering sensor data by 22 and got a pretty good fit).
For the oversteer/understeer calculation I simply subtracted the difference in the absolute values between the theoretical and actual steering angles. The visualization pretty much confirmed my butt feel in terms of oversteer/understeer. Where the actual steering angle is more than the theoretical steering angle, the car understeers. The opposite is true for oversteer.
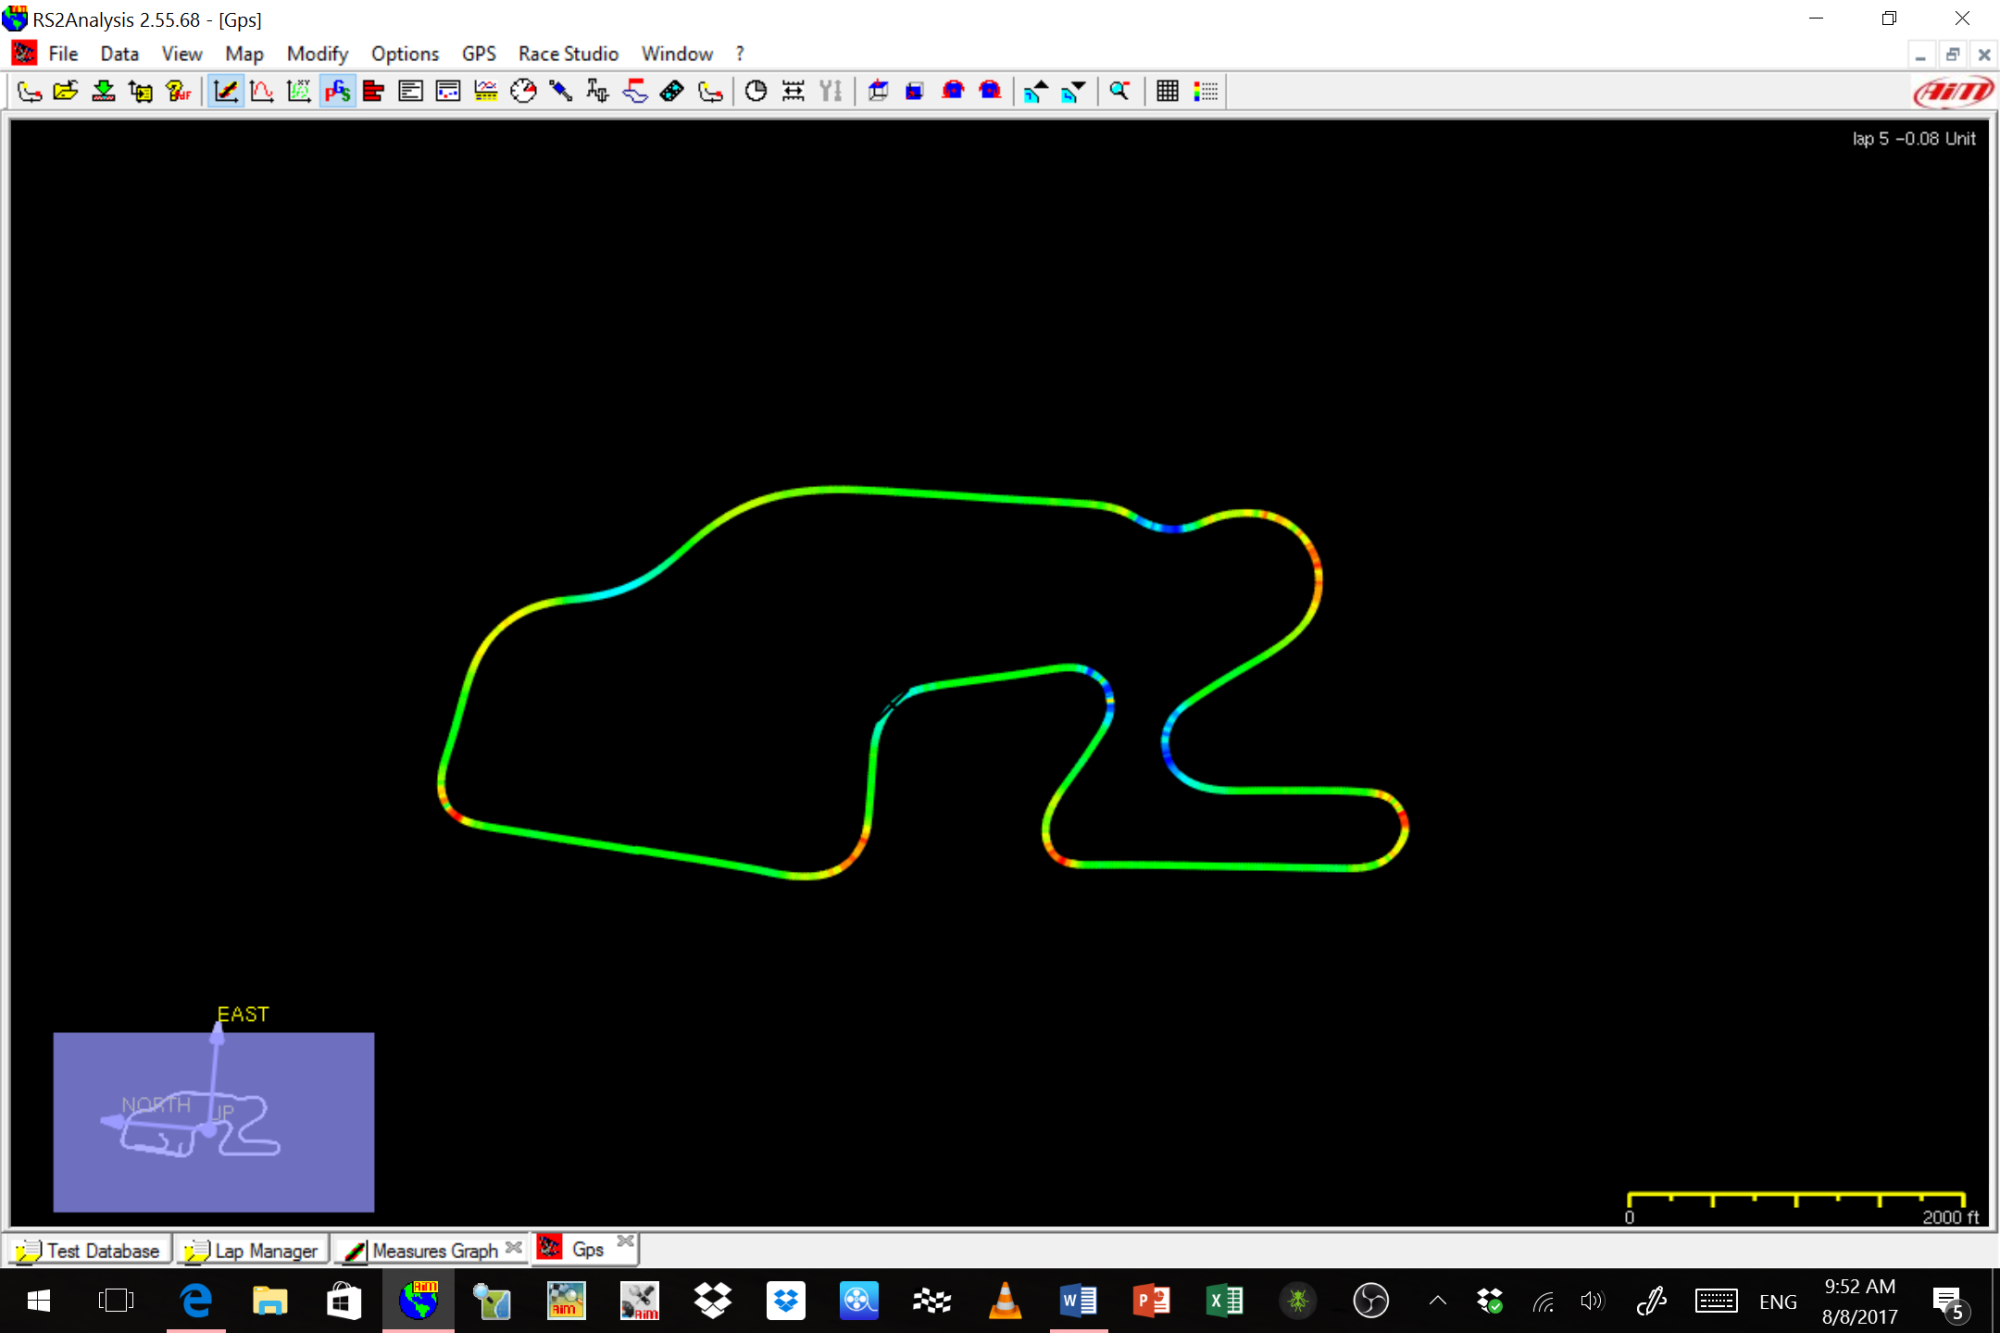
Visualization for Watkings Glen (my car was pushing like crazy) Red is Understeer - Blue is Oversteer:
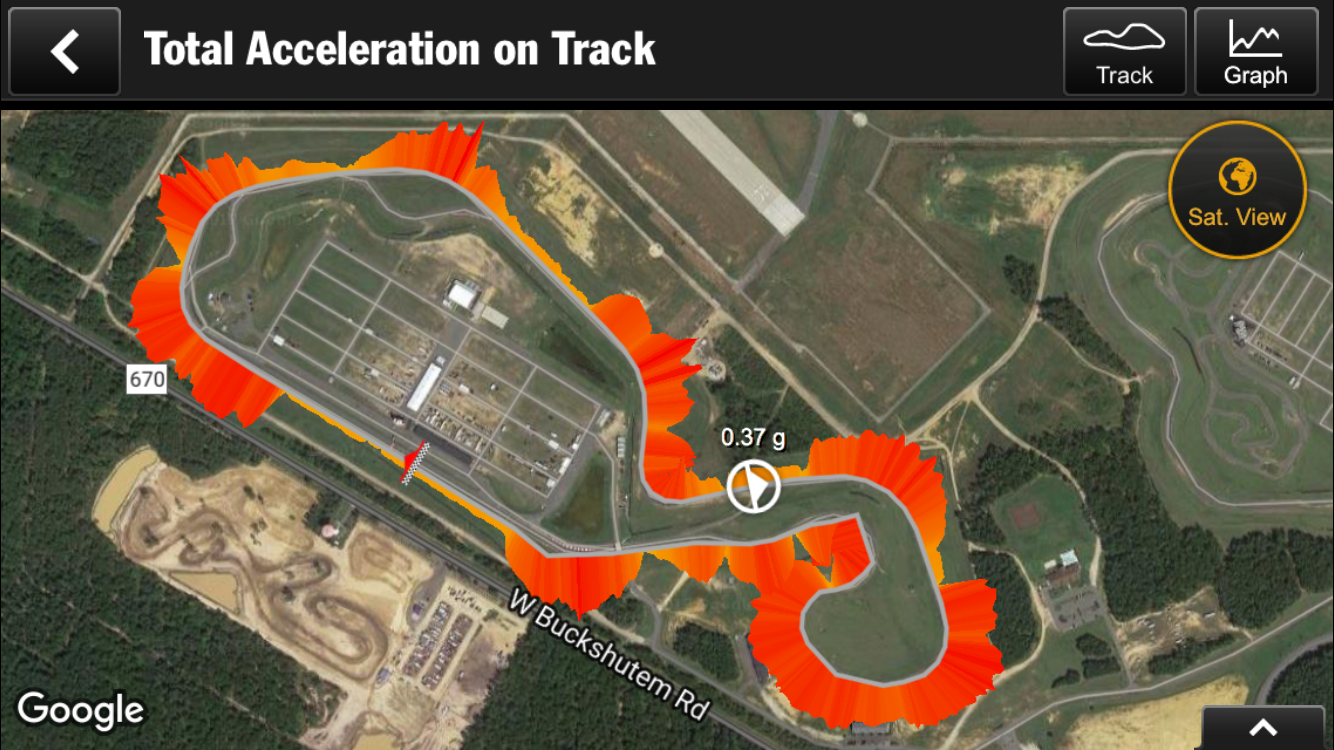
Visualization from NJMP Thunderbolt:
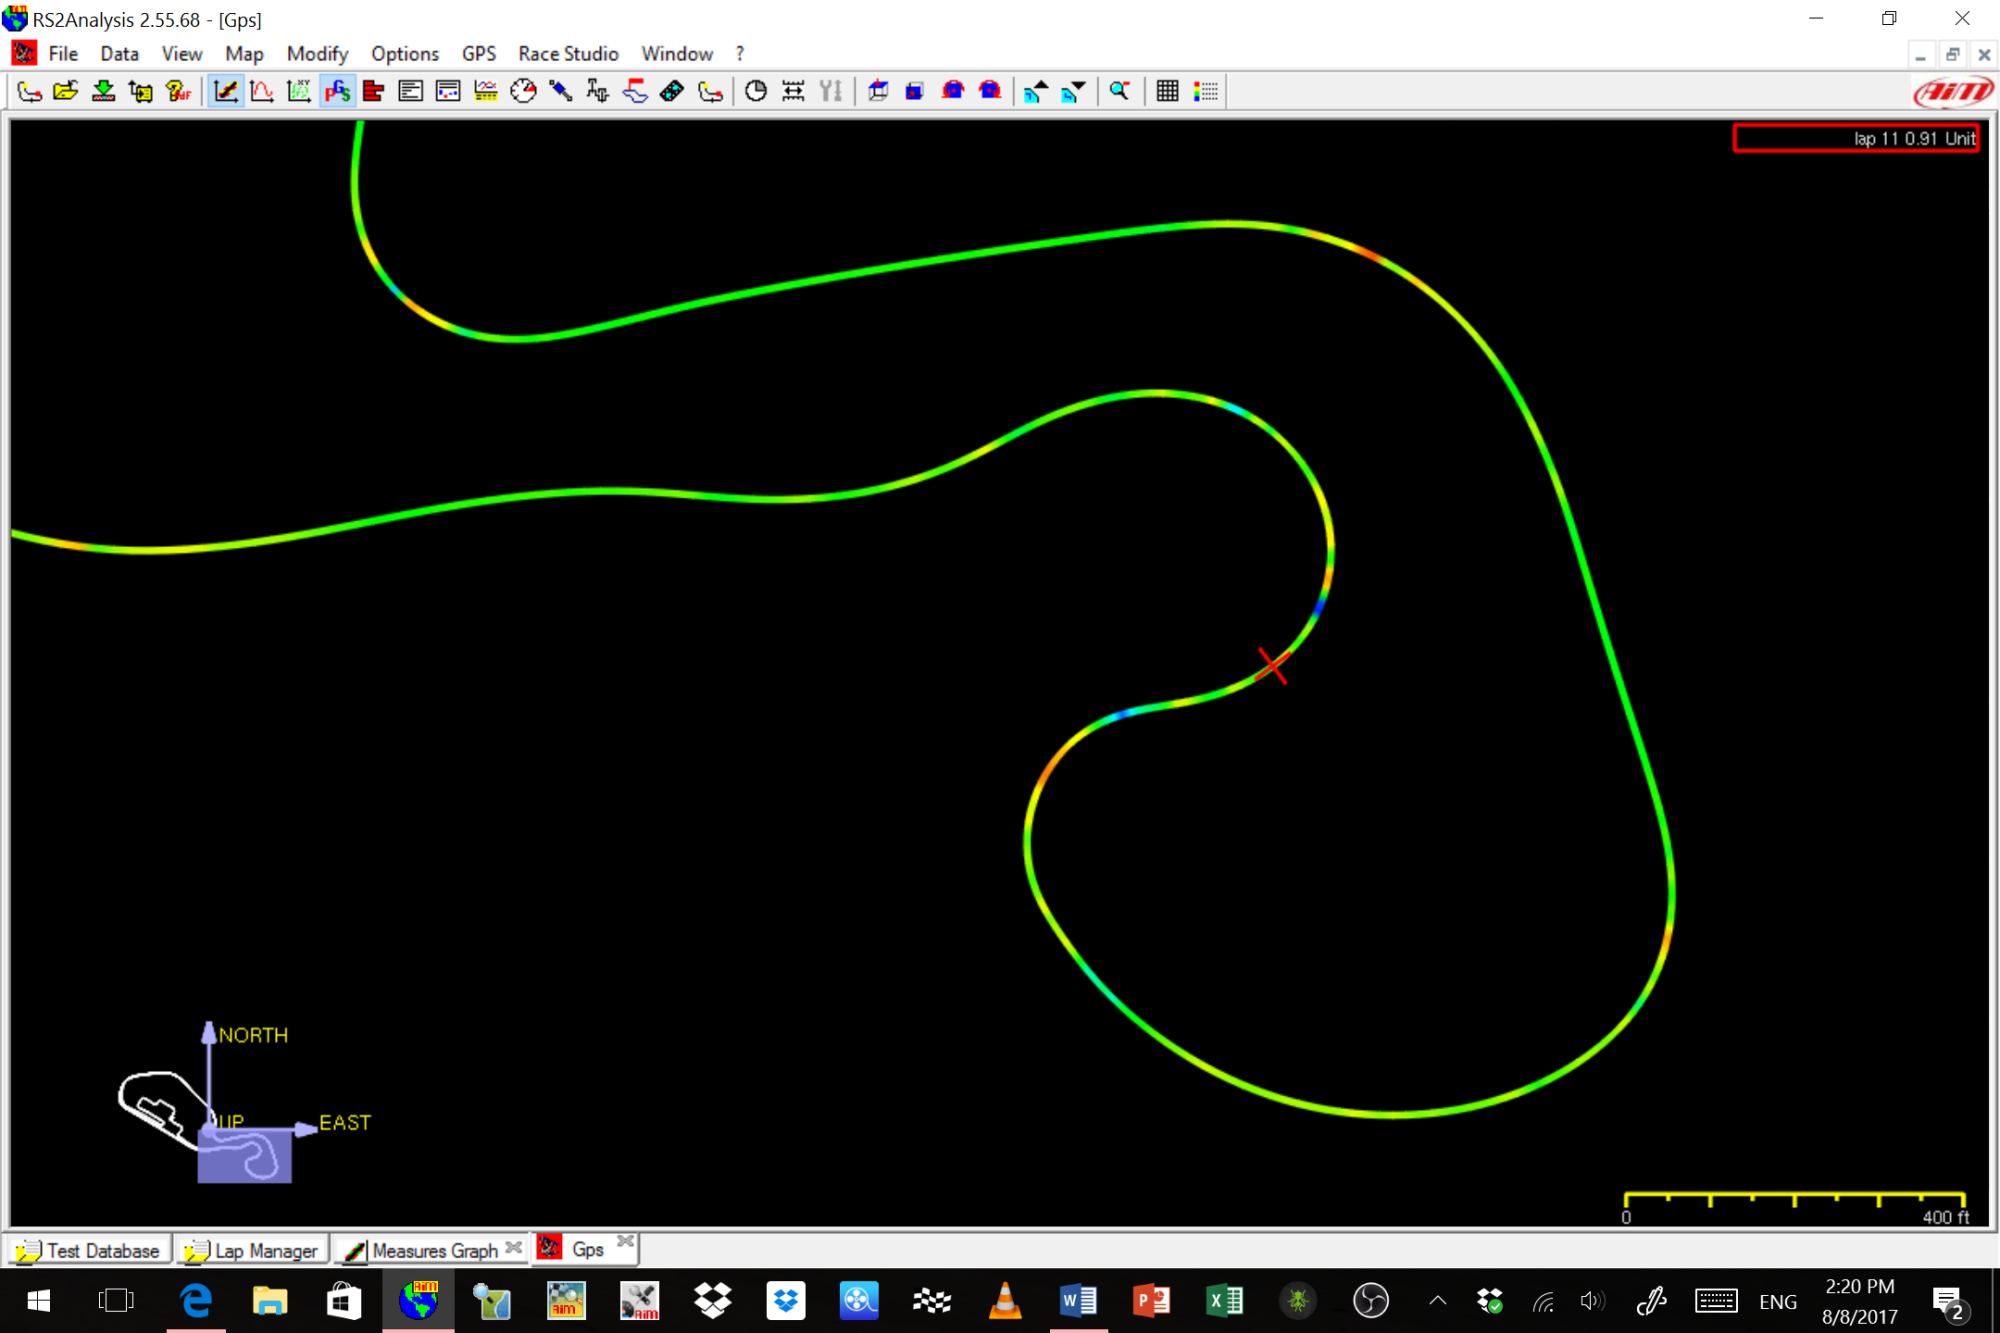
Detailed Visualization for the NJMP Thunderbolt Octopus which also confirmed my butt feel:
There are other ways to visualize understeer/oversteer by looking at the difference between GPS lateral Gs and system lateral Gs. In that case, you won't need a steering angle sensor.
__________________ -Peter Krause www.peterkrause.net www.gofasternow.com
"Combining the Art and Science of Driving Fast!"
Specializing in Professional, Private Driver Performance Evaluation and Optimization
Consultation Available Remotely and at VIRginia International Raceway
The colored GPS map is a great way to look at things. The only thing I don't like about using them is that they only show 1 lap. For quick overlays that don't need math channels, I like to use an X-Y graph with Lat G on the X axis and Steering Angle on the Y axis. If the car is perfectly neutral, it will be a straight line. If steering input increases and lat G doesn't , then it's understeer (the near vertical parts). Oversteer is the opposite. These graphs are also easy to overlay lots of laps for a good pre/post change comparison.
For more involved analysis, I like to take an average and then look at it on a lap by lap basis. IMHO, that is the best way to see how a car changes through a stint, as tires degrade, etc. You can also break it down to left vs right average, vs laptime, vs tire temp, etc. Lots of good ways to dig into the data.
If steering input increases and lat G doesn't , then it's understeer (the near vertical parts). Oversteer is the opposite.
I hope that OP doesn't mind as I have a question about this. In general, I see the line of thinking that if the car is going around a corner and its driver turns the steering wheel sharper and the lateral acceleration doesn't increase then it may be because of understeer. In this case, the plot will look like you describe Matt. However, it seems to me like the plot doesn't distinguish between high speed corners where the turn radius is high and smaller steering inputs are required versus hairpins where the corner radius is small and steering input is much larger. In each of these cases we want to use all of the available grip. If the lateral acceleration is approximately constant for the two cases but the steering input is different to allow for different corner radii, won�t that also make the plot look as noted above?
Instead, would it be better to plot steering angle versus corner radius where:
radius = speed^2 / LatG
If the driver inputs more steering angle and the corner radius doesn't decrease, then the car is understeering. What am I missing? Are you plotting some form of speed corrected steering in your plot Matt?
You are correct that it doesn't show any change for speed or corner radius. It's a quick and dirty way to look for understeer. I've found that it's pretty accurate. The graph below is my radius channel versus steering input for the same data show above.. I'd have to look at a few graphs, but it looks like it shows similar understeer.
When I want to break things down and look at specific periods like slow corners, fast corners, tight radius, large radius, etc, then I quantify the understeer similar to Frank's method (different math), then create math channels to break it all down. Then you can add the average w/o zero in a channel report to get some really good data for the lap.
Or if you are lazy or need to do something real quick, you can look at the XY for understeer while having a measure plot open with the speed trace and look to see the speed.
I also know a lot of data guys that look at the speed, steering, and lat G trace to see the understeer. Lots of different ways.
It's also important when talking about understeer like this to make sure it's not driver induced. Are there 2 turn ins? Rapid brake release? Large throttle application? Wrong hand speed? Too much brake with turning? Lots of ways we can make the car do bad things.
Thanks Matt for the detailed explanation. That answers my question. Namely, the steering vs. latG plot is just one way of visualizing data that can be used for showing understeer. There are others, which all have their strengths.
Steering Calculated is in degrees
Lateral G in "Gs"
Wheelbase in meters
Speed in M/S
My wheelbase for a 944S2 SP3 is 2.4M
My AIM math channel is: ((GPS_LatAcc*9.8*WHEELBASE)/(GPS_Speed*MPH2MS)^2 )*57.2958
Where WHEELBASE is a constant (2.4).
I got a good initial result, but by looking at low speed corners from a lap at Road America I needed to scale the calculated angle by about 2.5X to get a rough match:
It looked like I was having understeer in high speed turns; T1, T7, the carousel, T11 (kink). I did feel the understeer in T1 and a little in the carousel, but curiously not T13. So I'm guessing too much rear downforce?
I may have a little right turn bias as I calibrated the steering using only the left front wheel and did not switch to the right front for left hand turns during calibration.
My big question is; why do I need to scale the channel by 2.5X? Did I make a mistake on the math channel?
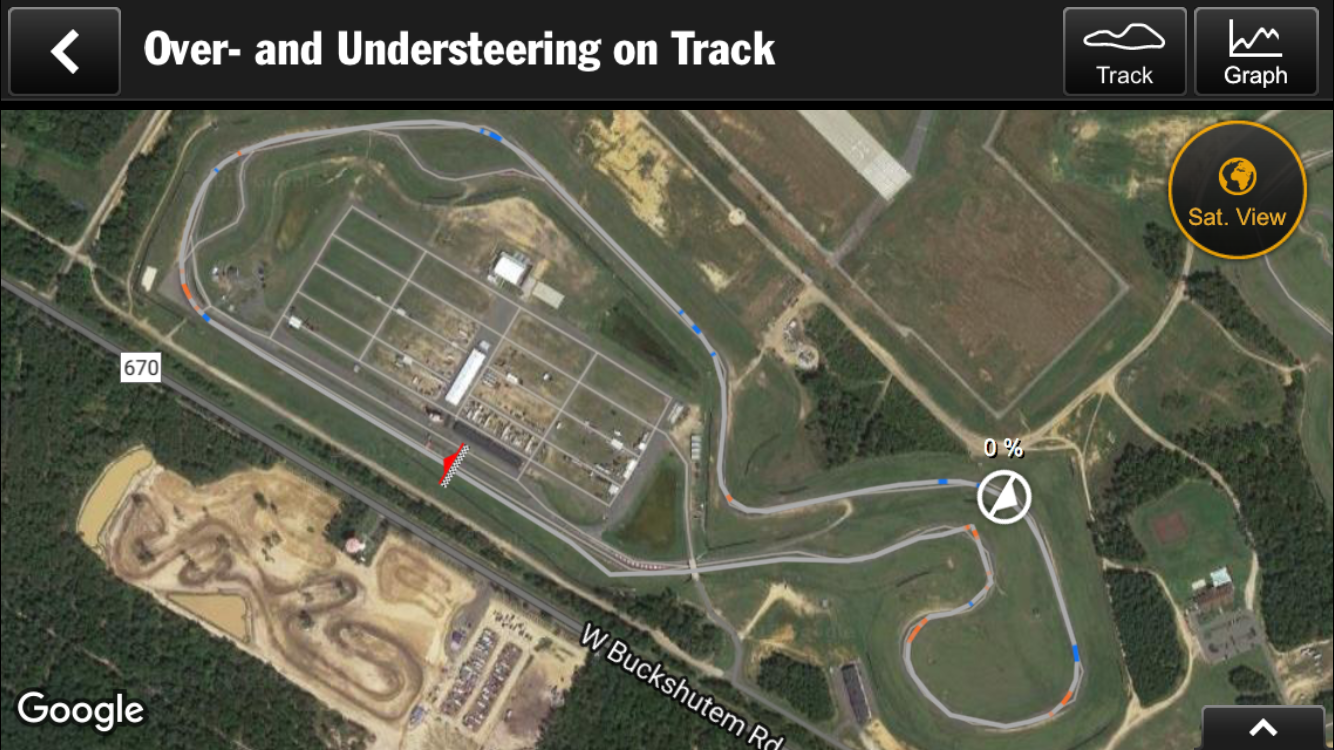
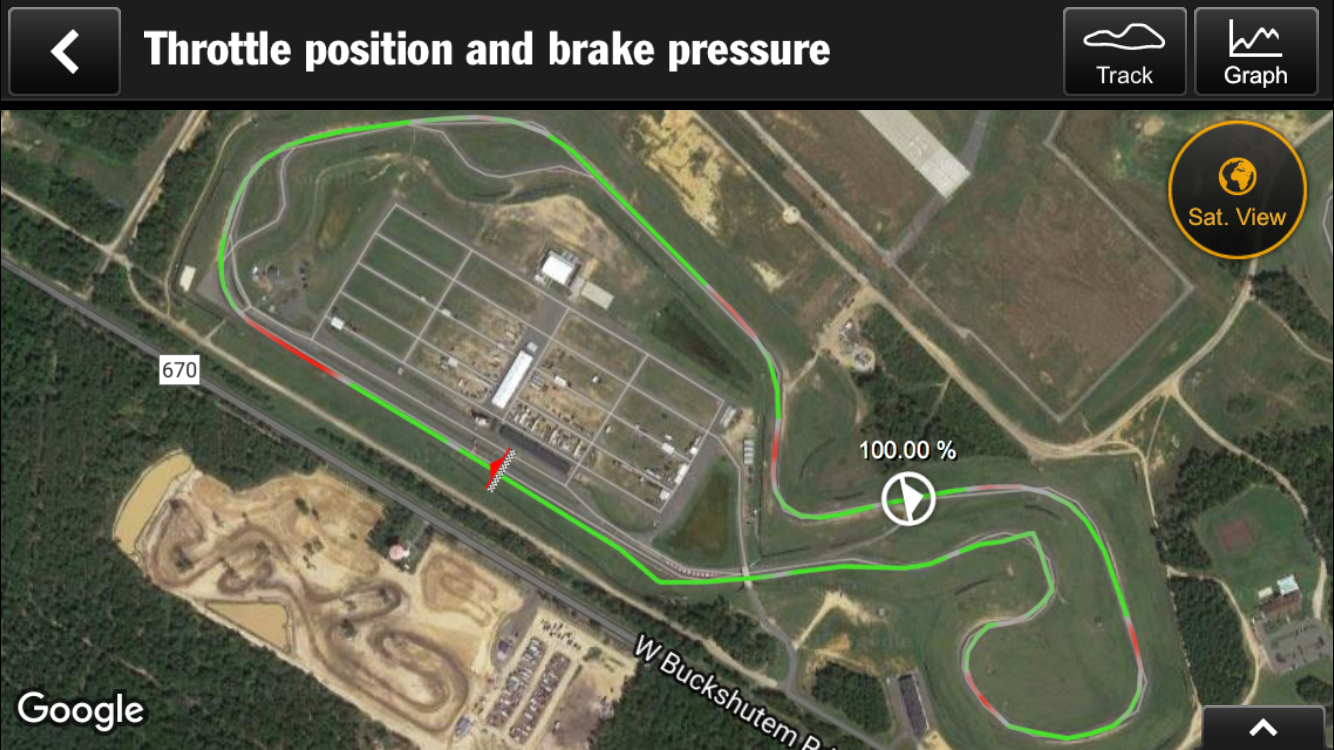
I keep loving my Porsche Track Precision App in the GT4
... It has had issues but it has so much good stuff: blue is oversteer, red is understeer
Does anyone know how TPA calculates these values? I have not had the chance to do a lot of analysis and compare that with my butt sensor, but I have had cases where I know I had oversteer but the TPA said I did not. The TPA understeer indicators seem to be more accurate according to what I am feeling.

 08-10-2017, 10:51 PM