When you click on links to various merchants on this site and make a purchase, this can result in this site earning a commission. Affiliate programs and affiliations include, but are not limited to, the eBay Partner Network.
OK so I've been watching the DOW as it swings wildly over the last 6 weeks. I have attached an image of a worksheet based on a 1995 C2/ 6MT with 60,000 miles on it in 8/10 condition valued at $50,000 before market fluctuation. Based on my data the best day to buy was on 1/13/16 and the worst day to buy was 1/29/16. I think Hagerty should use this model for valuation for a loss...
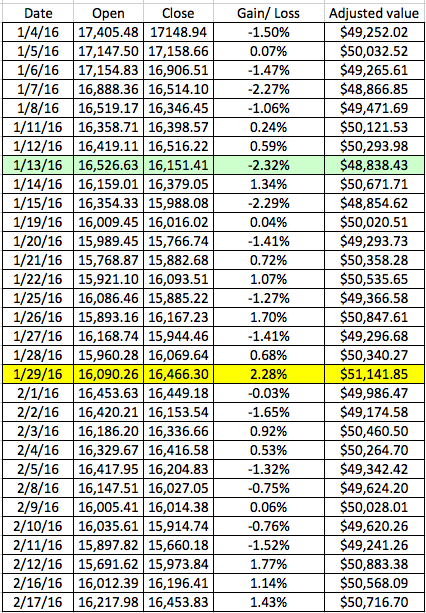
OK so I've been watching the DOW as it swings wildly over the last 6 weeks. I have attached an image of a worksheet based on a 1995 C2/ 6MT with 60,000 miles on it in 8/10 condition valued at $50,000 before market fluctuation. Based on my data the best day to buy was on 1/13/16 and the worst day to buy was 1/29/16. I think Hagerty should use this model for valuation for a loss...
Boy...you like to crunch numbers! Interesting analysis.
I have more data that I put into a Pivot table which itemizes monthly maintenance costs amortized to make it easier to understand. Then there is a negative effect on keeping full coverage insurance throughput the years by driving months dependent on time zone from GMT back to PST broken down by zip code. Its pretty straightforward. I tried to post it here but the smallest file is a little over 1tb...

 02-18-2016, 06:37 PM