
991.2 GT3 lightweighting project
 07-09-2018 | 08:03 PM
#46

Three Wheelin'
Joined: Oct 2012
Posts: 1,633
Likes: 13
From: Cocoa, FL
Hi Ryan, it's not that straightforward if you want to try and explain things with torque and lever arms, unfortunately. Yes, smaller radius means more tire patch force for the same torque. But is the torque the same as before you changed the tire radius (at a given speed)? No, it's not, because the smaller tire radius also reduced the engine RPM at the same time, and generally the engine torque is reducing as RPM is increasing, and when it gets high enough you're forced to shift to the next gear with an even lower numeric gear ratio. So did you end with a net positive change, or not?
Crunch all the numbers and you'll see that it's easier to just compare the engine power outputs rather than mess with engine torque * gear ratio * final drive ratio / tire radius to try and arrive at wheel force. But either method will arrive at the same answer.
For example, here is an analysis I did for the GT4 comparing the force to the ground with the stock 3.93 final drive vs. an aftermarket 4.62 that is available in each gear:
[img]https://dl.dropbox.com/s/0hmyruqm3s675uk/GT4%20Final%20Drive%20Comparison%20-%20Force%20vs%20Gear.png?
As you can see, at a given speed, sometimes the force available is higher with the old stock 3.93 final drive, and sometimes it's higher with the new 4.62 final drive. Can you explain why, at 55 mph, the stock 3.93 car is putting out more wheel force (and will there force accelerate more quickly at that time) than the modified 4.62 car?
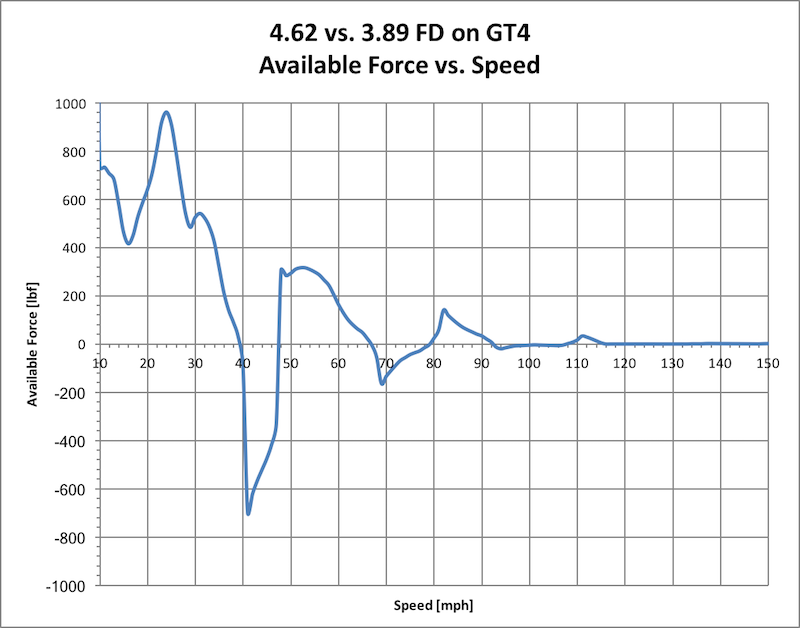
The explanation is straightforward: since the 4.62 forces the engine speed to be higher at a given vehicle speed, sometimes the 4.62 car is forced to be in the next gear (e.g., 4th gear) while the 3.93 car is still in the previous gear (e.g., 3rd gear). In general, the 4.62 car always makes more force to the ground at very low speeds, but once you get up to track speeds, which car makes more force depends on which speed you're at. Here's a plot of the *difference* between the curves:
[img]https://dl.dropbox.com/s/wxeu4v702iyaask/GT4%20Final%20Drive%20Comparison%20-%20Available%20Force%20vs%20Speed.png?
Or you could simply compare the power vs. speed curves and arrive at the same relative answer. Here is the same plot, but showing the difference in engine power output vs. speed:
[img]https://dl.dropbox.com/s/8hcvohefx7yjvdj/GT4%20Final%20Drive%20Comparison%20-%20Available%20Power%20vs%20Speed.png?
You'll notice the zero-crossing points are the same for the force vs. speed and power vs. speed plots. That's why I find it easier to just talk about power... since Force = Power / velocity, it's just easier to calculate than Force = Torque * gear ratio * final drive ratio / tire radius.
Crunch all the numbers and you'll see that it's easier to just compare the engine power outputs rather than mess with engine torque * gear ratio * final drive ratio / tire radius to try and arrive at wheel force. But either method will arrive at the same answer.
For example, here is an analysis I did for the GT4 comparing the force to the ground with the stock 3.93 final drive vs. an aftermarket 4.62 that is available in each gear:
[img]https://dl.dropbox.com/s/0hmyruqm3s675uk/GT4%20Final%20Drive%20Comparison%20-%20Force%20vs%20Gear.png?
As you can see, at a given speed, sometimes the force available is higher with the old stock 3.93 final drive, and sometimes it's higher with the new 4.62 final drive. Can you explain why, at 55 mph, the stock 3.93 car is putting out more wheel force (and will there force accelerate more quickly at that time) than the modified 4.62 car?
The explanation is straightforward: since the 4.62 forces the engine speed to be higher at a given vehicle speed, sometimes the 4.62 car is forced to be in the next gear (e.g., 4th gear) while the 3.93 car is still in the previous gear (e.g., 3rd gear). In general, the 4.62 car always makes more force to the ground at very low speeds, but once you get up to track speeds, which car makes more force depends on which speed you're at. Here's a plot of the *difference* between the curves:
[img]https://dl.dropbox.com/s/wxeu4v702iyaask/GT4%20Final%20Drive%20Comparison%20-%20Available%20Force%20vs%20Speed.png?
Or you could simply compare the power vs. speed curves and arrive at the same relative answer. Here is the same plot, but showing the difference in engine power output vs. speed:
[img]https://dl.dropbox.com/s/8hcvohefx7yjvdj/GT4%20Final%20Drive%20Comparison%20-%20Available%20Power%20vs%20Speed.png?
You'll notice the zero-crossing points are the same for the force vs. speed and power vs. speed plots. That's why I find it easier to just talk about power... since Force = Power / velocity, it's just easier to calculate than Force = Torque * gear ratio * final drive ratio / tire radius.
Drag race guys have been doing this for years, higher numerical ratio to get more force at the pavement combined with wider, stickier tires (drag radials) to minimize wheel spin and maximize the amount of force converted to forward acceleration.
For the road racer, choosing the correct final drive ratio for a given track is more complicated and would be unique for each car, engine, tire and environmental conditions.
If you'd like to discuss it offline, shoot me a PM.
Ryan
07-09-2018 | 08:04 PM
#47

Burning Brakes
Joined: Dec 2017
Posts: 866
Likes: 475
Porsche official weight figures have always been in the lightest possible spec....just check all the various independent tests for proof..I have heard that very recently(2018) that Porsche now quote weights based on the bog standard spec but this bit is anecdotal..
07-09-2018 | 08:37 PM
#49
Rennlist Member
Joined: Aug 2016
Posts: 1,767
Likes: 446
From: Fairfield County, CT
Originally Posted by Riz
Bose added weight, l would have skipped it
07-10-2018 | 02:07 AM
#50

Nordschleife Master
Joined: Oct 2014
Posts: 5,403
Likes: 635
I believe there are some embedded assumptions in your analysis. You're looking at instantaneous acceleration rather than the volume under the curve. For instance, take your first diagram and note that the force under the curve for each gear is higher though the position of the curve on the X (velocity axis) is shifted to the left (lower) as I mentioned before the top speed available in each gear is decreased as the effective final drive ratio increases.
Drag race guys have been doing this for years, higher numerical ratio to get more force at the pavement combined with wider, stickier tires (drag radials) to minimize wheel spin and maximize the amount of force converted to forward acceleration.
For the road racer, choosing the correct final drive ratio for a given track is more complicated and would be unique for each car, engine, tire and environmental conditions.
If you'd like to discuss it offline, shoot me a PM.
Ryan
I'd draw your attention again to this "relative force curve" plot showing how much more or less force is available in the higher numerical final drive GT4 vs. the stock GT4:
Yes, while I do talk about instantaneous acceleration at certain speeds (primarily to dispel the misunderstanding that smaller diameter wheels and tires would enable the car to accelerate more quickly at every speed), you certainly need to consider integrating these curves to get a sense of relative benefit over different speed ranges.
For your "drag racer" example, you can clearly see that the higher numerical final drive has a huge force curve advantage at low speeds, which will certainly result in faster 0-60 times and lower 1/4 mile times (assuming traction is not limiting), no question!
But on the track, this is not so simple since you are never in 1st and incredibly rarely in 2nd gear. Here it matters which speed ranges you are exercising, and the results will vary track-to-track.
What's my point? The universal conclusion that running smaller diameter tires on track will result in lower lap times is false. Sounds like we're in agreement on that.

 07-11-2018 | 03:00 AM
#52
Nordschleife Master
Joined: Oct 2014
Posts: 5,403
Likes: 635
Here's a force to the ground plot for the 991.1 GT3 over a wide range of speed (50 mph to 150 mph), for both a car on stock 305-30R20 tire vs. a 1" smaller diameter 305-30R19 tire. If you calculate the total area under each of these curves over this range, the result is less than a 1% difference...

 07-11-2018 | 03:49 AM
#55
SJW, a Carin' kinda guy
Rennlist Member
Rennlist Member
Joined: Apr 2008
Posts: 6,786
Likes: 622
From: On the internet
07-22-2018 | 02:38 PM
#56

Burning Brakes
Joined: Mar 2018
Posts: 834
Likes: 301
07-22-2018 | 02:40 PM
#57
Burning Brakes
Joined: Mar 2018
Posts: 834
Likes: 301
I have Dundon race headers and antigravity light weight battery on hand to be install on delivery. My Touring will have PCCB, lwbs, fal, xenon, bose, leather.
The only other thing I�m looking to add are the BBS magnesium wheels, but waiting to see if they can do light silver finish. Despite the price of the mags, I�m justifying it in my head because it�s rotating mass. But I wouldn�t spend the same amount per lbs for static weight, so fenders, hood, etc, are out of the equation. I just gotta get back in the gym. Seriously.
The only other thing I�m looking to add are the BBS magnesium wheels, but waiting to see if they can do light silver finish. Despite the price of the mags, I�m justifying it in my head because it�s rotating mass. But I wouldn�t spend the same amount per lbs for static weight, so fenders, hood, etc, are out of the equation. I just gotta get back in the gym. Seriously.
07-22-2018 | 02:44 PM
#58
Burning Brakes
Joined: Mar 2018
Posts: 834
Likes: 301
I see these numbers posted for the cars
3150lbs 2019 gt3rs
3153lbs 2018 pdk GT3
3116lbs 2018 Manual gt3
Not sure if the weight listed for the RS included magnesium wheels.
Either way, your weight with LEDs 12-14lbs and FAL10-13lbs puts you back to relatively close to pdk territory. A burrito and a couple beers could put your over
 07-22-2018 | 02:47 PM
#59
Burning Brakes
Joined: Mar 2018
Posts: 834
Likes: 301
Well you probably weigh about 100lbs less than me and there are things I won�t do to save weight too. :-)
Do you have part numbers or a link to the T/3RS.2 glass? For $1500 I would do the rear window as I dislike the defroster lines and find them distracting.
Peter Stout commented on the T glass in his review of the T and GT3 touring thread.
07-22-2018 | 06:21 PM
#60
Three Wheelin'
Joined: Jun 2009
Posts: 1,921
Likes: 308