
Trying to get a flat boost curve. eBoost2
 03-30-2012, 05:31 AM
#1
Professional Hoon
Rennlist Member
Rennlist Member
Thread Starter
Join Date: Jan 2010
Location: Melbourne, Australia
Posts: 7,090
Likes: 0
Received 4 Likes
on
4 Posts
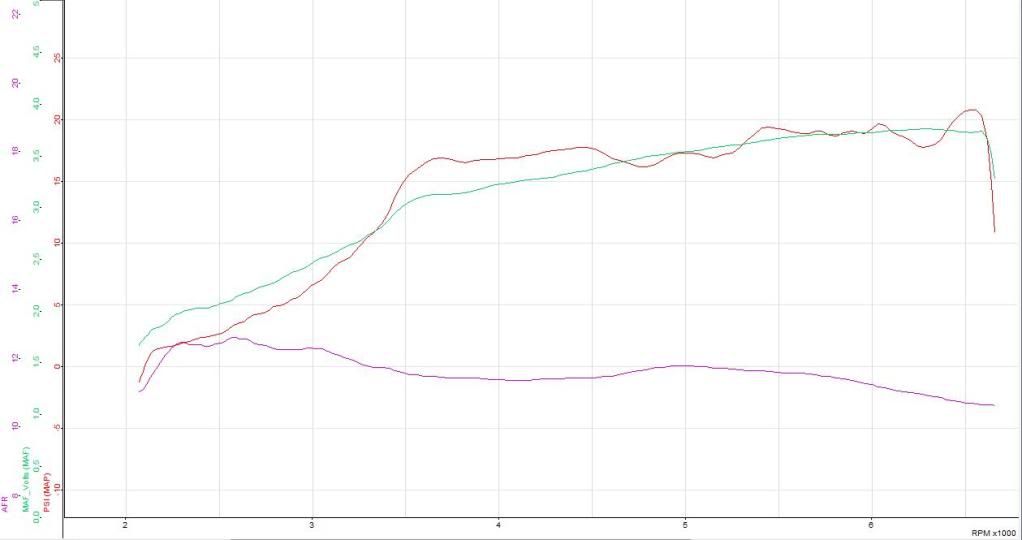
now that my data logger works, my boost curve isn't that great.
the log has zigzag sharp spikes and i'm not sure if the eBoost is doing this, the MAP sensor (being close to the manifold) or the LM-2
Boost
TPS
MAF
This was done on wastegate spring ~7psi with GP (gate pressure, where solenoid opens to regulate boost) 0. SN (Sensitivity in change in boost pressure.max30):0 and SP (Set Point, solanoids duty cycle):0
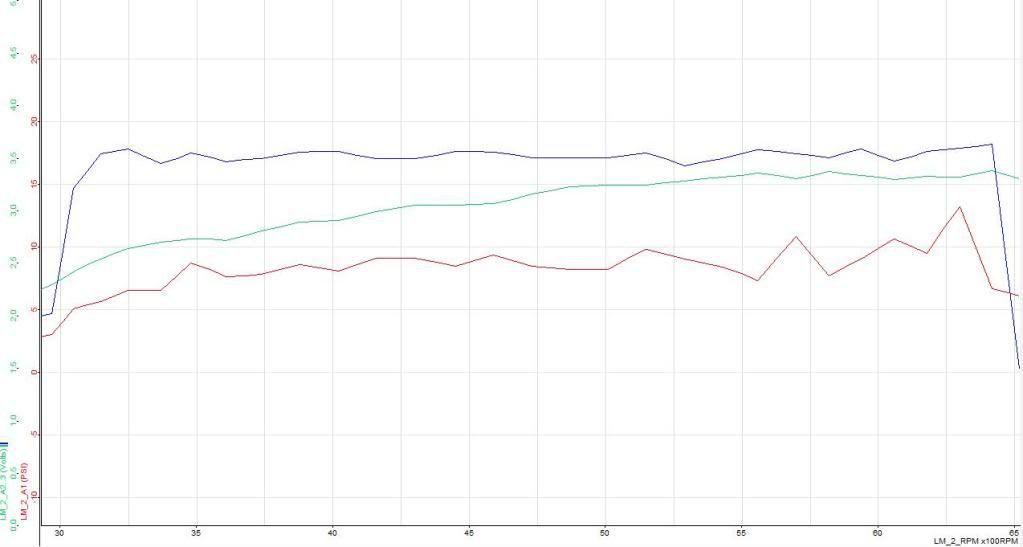
This 2nd log was ~16psi according to eBoost2 peak boost. GP:10, SN:0, SP:50.
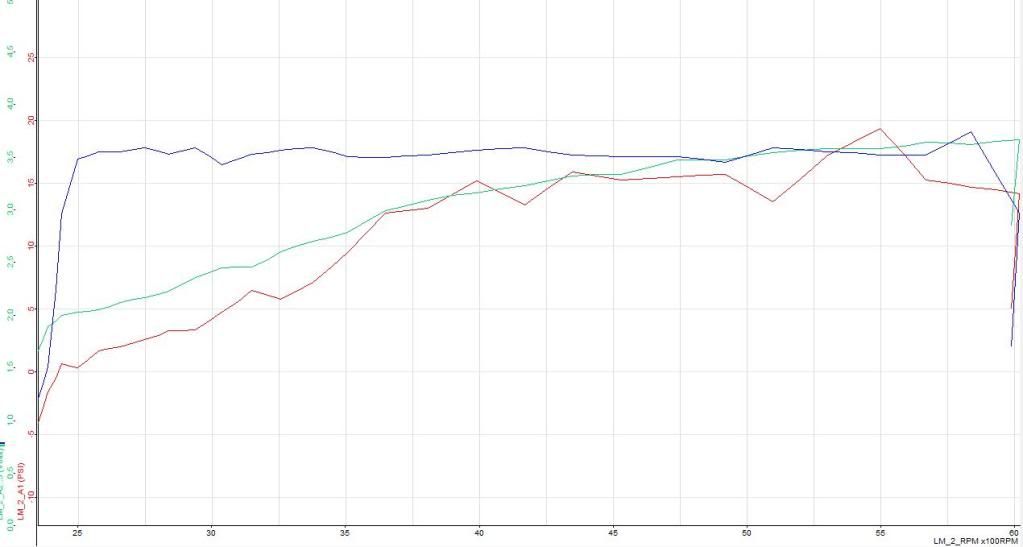
I can't work out if it is a flat boost curve or it's not because of the sharp points.
Anyone have any idea.
I'll be updating the logs with different sensitivity 5,10,15 ect. in the next few days.
the log has zigzag sharp spikes and i'm not sure if the eBoost is doing this, the MAP sensor (being close to the manifold) or the LM-2
Boost
TPS
MAF
This was done on wastegate spring ~7psi with GP (gate pressure, where solenoid opens to regulate boost) 0. SN (Sensitivity in change in boost pressure.max30):0 and SP (Set Point, solanoids duty cycle):0
This 2nd log was ~16psi according to eBoost2 peak boost. GP:10, SN:0, SP:50.
I can't work out if it is a flat boost curve or it's not because of the sharp points.
Anyone have any idea.
I'll be updating the logs with different sensitivity 5,10,15 ect. in the next few days.
 03-30-2012, 11:47 AM
#2
Drifting
The first thing I would do if you haven't already, is to physically shorten the feedback loops. The pressure waves move relatively slowly, so you want to have your sensor and wastegate lines minimizing this delay. After that it's time to tackle the boost controller. I'm not sure how your controller works, but it's probably a PID with some ability to fiddle with the values. There's a pretty good write up in the megasquirt-extra manual about how to tune boost control.
03-30-2012, 03:21 PM
#3
Professional Hoon
Rennlist Member
Rennlist Member
Thread Starter
Join Date: Jan 2010
Location: Melbourne, Australia
Posts: 7,090
Likes: 0
Received 4 Likes
on
4 Posts
what do you mean by feedback loops?
1 thing i noticed. the sensor will spike at 20 psi, not tirgger over boost and won't show on the peak boost on the eBoost2
1 thing i noticed. the sensor will spike at 20 psi, not tirgger over boost and won't show on the peak boost on the eBoost2
03-30-2012, 03:27 PM
#4
Professional Hoon
Rennlist Member
Rennlist Member
Thread Starter
Join Date: Jan 2010
Location: Melbourne, Australia
Posts: 7,090
Likes: 0
Received 4 Likes
on
4 Posts
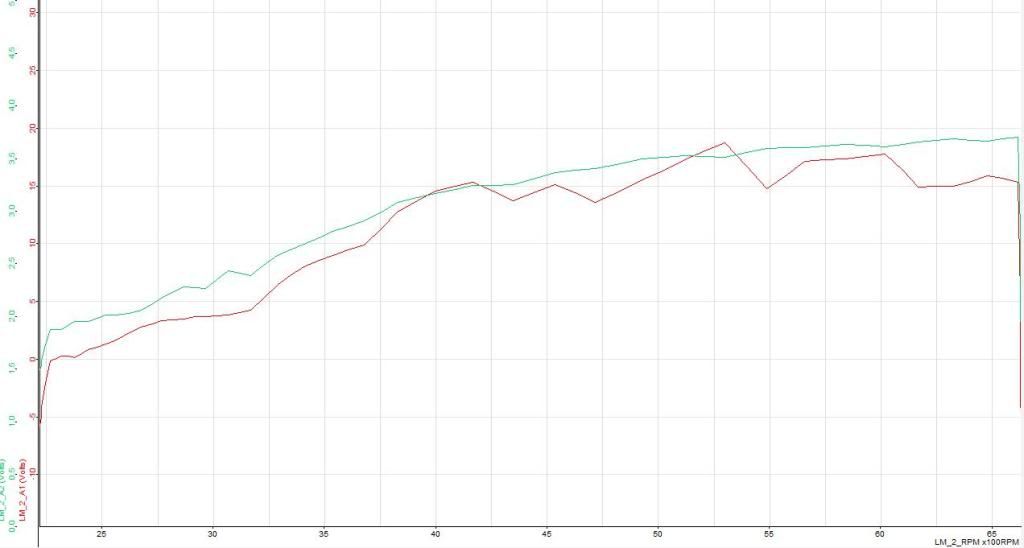
These next to data logs are:
1st one is with the sensitivity changed to 5
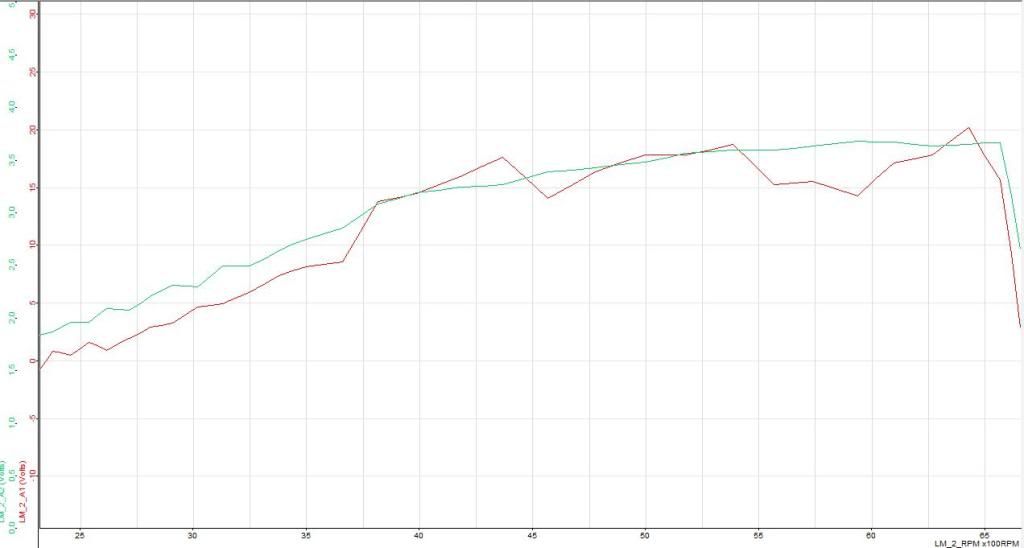
and the 2nd one is with the sensitivity on 10
Everything else is the same
1st one is with the sensitivity changed to 5
and the 2nd one is with the sensitivity on 10
Everything else is the same
03-30-2012, 04:44 PM
#5
Drifting
Trace the path that the signal has to follow to maintain the boost level. For example with no boost controller, just the wastegate, it would be the line from the hard pipe to the wastegate. The wastegate bleeds boost when it sees pressure over the amount required to open the spring. The trick is the pressure wave takes time to travel along the hose. By the time the pressure wave reaches the wastegate, the actual boost level will have overshot. The next low pressure signal again takes time to get to the wastegate and you get undershoot. Basically, keep your lines as short as you can.
Anything in the system that introduces lag will make it harder to nail a perfect boost curve. Wastegates don't open instantly, an electronic boost control located in the cabin has to wait for the pressure signal to go through the whole intake tract and up the vaccuum line to the boost controller before the cpu can even start to make a decision as to what signal to send to the solenoid.
I don't think you can ever get a perfectly flat line, but minimizing oscillations is a good goal.
03-30-2012, 04:55 PM
#6
Professional Hoon
Rennlist Member
Rennlist Member
Thread Starter
Join Date: Jan 2010
Location: Melbourne, Australia
Posts: 7,090
Likes: 0
Received 4 Likes
on
4 Posts
i don't think i'll get a perfect line, something like the first line i'll be happy with.
the boost lines are as short as they can be. the solenoid is located on the firewall on the left hand side that separates the battery compartment from the engine bay. except my battery isn't there. the wastegate lines are long enough to make the solenoid and back.
the boost lines are as short as they can be. the solenoid is located on the firewall on the left hand side that separates the battery compartment from the engine bay. except my battery isn't there. the wastegate lines are long enough to make the solenoid and back.

Trending Topics
03-31-2012, 12:53 AM
#9
Addict
Rennlist Member
Rennlist
Small Business Partner
Rennlist Member
Rennlist
Small Business Partner
03-31-2012, 03:28 AM
#11
Rennlist Member
Maybe your sensitivity is set too high?
03-31-2012, 03:53 AM
#12
Professional Hoon
Rennlist Member
Rennlist Member
Thread Starter
Join Date: Jan 2010
Location: Melbourne, Australia
Posts: 7,090
Likes: 0
Received 4 Likes
on
4 Posts
highest is 30 they say, even it goes a lot higher.
the graphs go from 0 (lowest) to 10 in increments of 5. and they're just solid numbers 1,2,3,4,5 ect.
The sensitivity on 5 looks pretty good.
the graphs go from 0 (lowest) to 10 in increments of 5. and they're just solid numbers 1,2,3,4,5 ect.
The sensitivity on 5 looks pretty good.
04-01-2012, 11:15 AM
#13
Professional Hoon
Rennlist Member
Rennlist Member
Thread Starter
Join Date: Jan 2010
Location: Melbourne, Australia
Posts: 7,090
Likes: 0
Received 4 Likes
on
4 Posts
okay i've just been reviewing the logs and also posting on the TurboSmart forum.
i posted this log:
Smoothing: 0.00
And one of the mods posted this:
at the time the sensitivity was set somewhere between 10-15
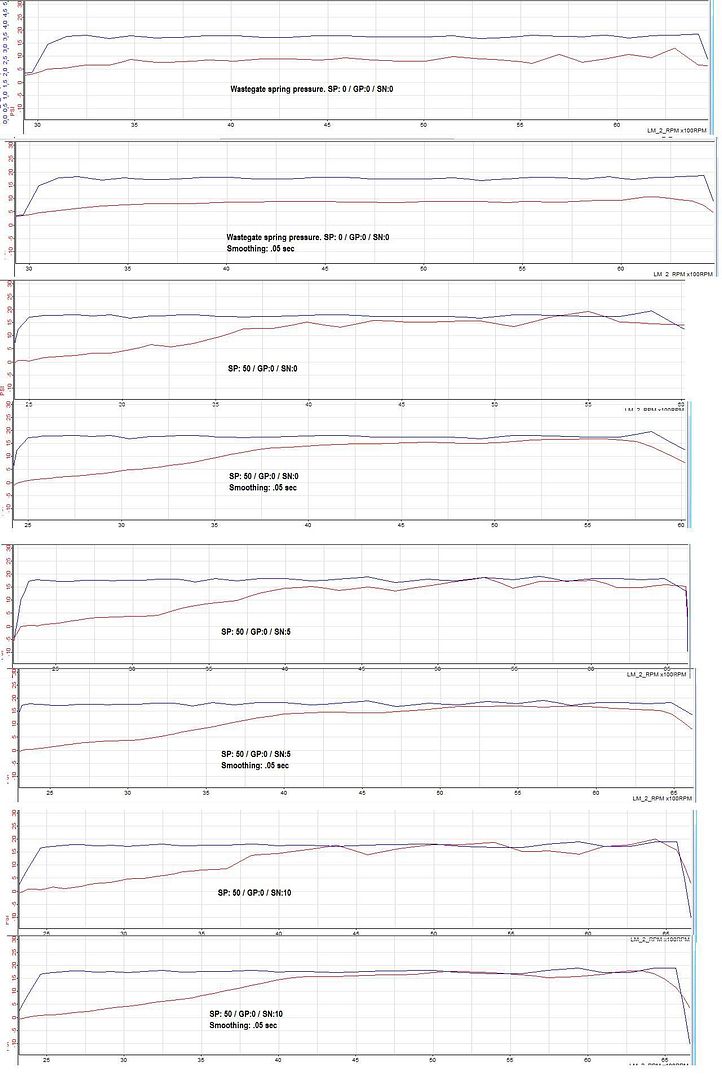
Here's the same logs from before except under each one is one with the boost line smoothed by .5 seconds.
i posted this log:
Smoothing: 0.00
And one of the mods posted this:
Paulyy,
In regards to setting the sensitivity, please read the instruction manual for the eBoost2.
Sensitivity on an eBoost2 basically changes the duty cycle to match the pressure from the wastegate.
Looking at your boost curve, it seems that your car is extremely sensitive.
We suggest you start at 0 and work your way up to see how steady your curve is.
Here's the same logs from before except under each one is one with the boost line smoothed by .5 seconds.
Last edited by Paulyy; 04-03-2012 at 07:25 AM.
04-02-2012, 11:44 AM
#14
Addict
Rennlist Member
Rennlist Small
Business Sponsor
Rennlist Member
Rennlist Small
Business Sponsor
Whats the sampling rate on your data logger? You may have the pressure datalogger at a low sampling rate – that will result in the peaks you are seeing in the graph. It looks like that’s the case since the graph looks like the pressure is sampled every 200rpm +/-. If the acceleration rate is constant then it will show up as consistent steps when plotted against RPM.
Smoothing will make the graph ‘look’ smoother – but it means you are not seeing the real data. Most data loggers do not continuously log the data – they look at the sensor at predetermined points in time based on the sampling rate and record the data for that exact point in time. In theory you could have 25 psi peaks and 0 psi valleys that are not showing up because the full peak / valley does not occur at the exact sampling point.
Your data looks like a small number of points joined together by a line – you need to get better sampling resolution before you worry about tweaking the eBoost2.
04-02-2012, 02:53 PM
#15
Professional Hoon
Rennlist Member
Rennlist Member
Thread Starter
Join Date: Jan 2010
Location: Melbourne, Australia
Posts: 7,090
Likes: 0
Received 4 Likes
on
4 Posts
Thanks Chris,
I'm still getting use to using a data logger and all the features it has ect.
from the manual it say:
Packet/Logging Speed 81.92 msec/sample packet
Sample Resolution 10 bits (0..5V at 0.1% resolution)
I need to figure out how to change the sample rate
I'm still getting use to using a data logger and all the features it has ect.
from the manual it say:
Packet/Logging Speed 81.92 msec/sample packet
Sample Resolution 10 bits (0..5V at 0.1% resolution)
I need to figure out how to change the sample rate