
My Dyno Graph from sunday....
 06-21-2004, 07:05 PM
#1
Nordschleife Master
Thread Starter
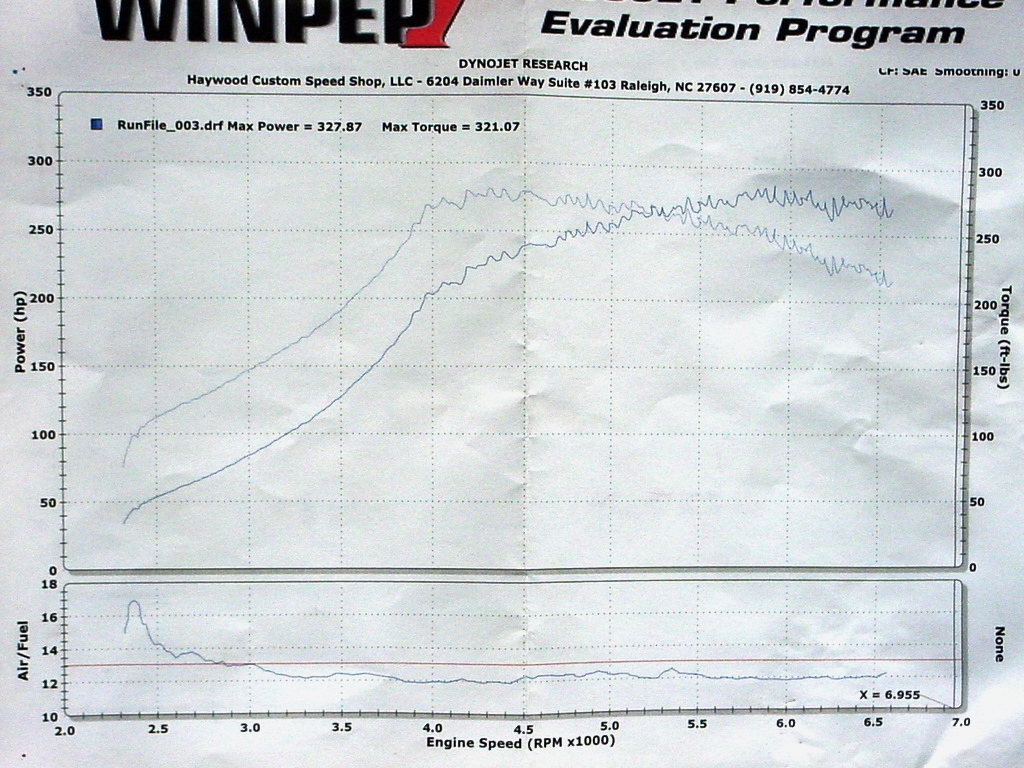
Excuse the quality, I had to take a digi pic of the print out.
93 Degree Day, Poor Cooling of the IC (one fan), and 17psi.
Car still needs more tuning to be ideal, but I think its safe right now, and that was the most important thing.
93 Degree Day, Poor Cooling of the IC (one fan), and 17psi.
Car still needs more tuning to be ideal, but I think its safe right now, and that was the most important thing.
 06-21-2004, 07:11 PM
#2
Pro
Join Date: Oct 2003
Location: Ames, Ia
Posts: 666
Likes: 0
Received 0 Likes
on
0 Posts
I don't know much about how these engines make power on dynos, but what would make the power studder or go up and down a lot from 4k on. Looks like a squiggly line. Is that boost fluctuating or maybe something with the ignition? Again, I have no clue, I'd just like to know. TIA - Mike

 06-21-2004, 08:07 PM
#5
Addict
Rennlist Member
Rennlist Member

The graph roughness could be because the dyno software's smoothing was not turned on.
The numbers not matching the graph could be the graph showing power at the wheels and the numbers being power at the flywheel.
Just speculation.
Sam
The numbers not matching the graph could be the graph showing power at the wheels and the numbers being power at the flywheel.
Just speculation.
Sam
06-21-2004, 08:46 PM
#6
A chassis dyno like this one only measures wheel power. It would be pointles to convert to BHP. You would need to calculate wheel diameter, gearing, driveline loss etc, to do that.
It's just not reasonable.
It's just not reasonable.
Trending Topics
06-21-2004, 09:02 PM
#8
Three Wheelin'

Join Date: Jul 2001
Location: Reading PA
Posts: 1,667
Likes: 0
Received 0 Likes
on
0 Posts
Your chart looks a little better than Randys with the boost build up but it still looks like you are not hitting full boost until after 4000rpm.
I would say the jagged lines are because they did not use the smoothing on the dyno software my latest dyno run has a smoothing: 5. I have no idea why they have different peak numbers on the chart they seem more reasonable then the graphed line though. Did this shop just purchase the dyno and maybe they don't know how to setup the software properly?
I would say the jagged lines are because they did not use the smoothing on the dyno software my latest dyno run has a smoothing: 5. I have no idea why they have different peak numbers on the chart they seem more reasonable then the graphed line though. Did this shop just purchase the dyno and maybe they don't know how to setup the software properly?
06-21-2004, 09:25 PM
#9
Addict
Rennlist Member
Rennlist Member
All chassis dyno results can be converted to BHP, using a set percentage correction factor for driveline loss. Wheel diameter and gearing are irrelevant on the dyno.
Sam
Sam
06-21-2004, 09:39 PM
#11
Addict
Rennlist Member
Rennlist Member
I have the WinPep 7 viewing software for plotting Dynojet data and here's what I know about it:
The smoothing factor can be varied over a numerical range of 0 (minimum) to 5 (maximum). You can see on the upper right corner of the posted chart that the smoothing is 0, which explains the "roughness" of the plots.
One of the options you can select in the software is to "print" the maximum torque and hp numbers, as you see in the chart here. It just picks the maximum points off the curves. However, I've never seen a case where the maximum numbers didn't agree with the curves themselves. Something is wrong here.
The raw dyno data is collected from the dyno over a software interface and there are a bunch of calibration factors that have to be set in software by the dyno operator in order for the data to be valid. My guess (and it's just a guess) is that the dyno operator didn't set the dyno calibration correctly so the data is incorrect.
BTW you can download the WinPep 7 viewing software directly from the Dynojet Web site. It's a free download, but it requires real Dynojet data files in order for it to be of any use.
Ian: if you can e-mail me your Dynojet raw data files (they have a .drf file type), I'll plot them in my software and see if I get the same results.
06-22-2004, 02:32 AM
#13
No..... the dyno sucks. Vitesse has been proven...if you read this, you would know we need to TUNE our cars further, in conjunction to finding out what the deal is with the dyno we used....
if you dont have anything usefull to contribute, dont reply.
if you dont have anything usefull to contribute, dont reply.
06-22-2004, 02:42 AM
#14
Racer

Join Date: Oct 2003
Location: Canada
Posts: 477
Likes: 0
Received 0 Likes
on
0 Posts
Originally posted by ECUdooberhead
No..... the dyno sucks. Vitesse has been proven...if you read this, you would know we need to TUNE our cars further, in conjunction to finding out what the deal is with the dyno we used....
if you dont have anything usefull to contribute, dont reply.
No..... the dyno sucks. Vitesse has been proven...if you read this, you would know we need to TUNE our cars further, in conjunction to finding out what the deal is with the dyno we used....
if you dont have anything usefull to contribute, dont reply.
And please, don't get personal.
06-22-2004, 02:45 AM
#15
yes, read the thread. There is an issue with the dyno- the peak numbers dont line up with the graph- same deal with my car (I have the same setup as Ian and dynod my car with him and Ahmet). We are going to check with the dyno owner and find out what the deal is- hopefully we'll workout a free redyno once the problem is resolved!
-Randy
-Randy