When you click on links to various merchants on this site and make a purchase, this can result in this site earning a commission. Affiliate programs and affiliations include, but are not limited to, the eBay Partner Network.
I remember checking that last year and the liquid was creamy with no bubbles, haven't checked this year. It's doing the same thing as last year and the year before.
I will have to check for leaks when I store it, right now enjoying the drives. I do have one of my vents (comb flap I think) which is not operating like it should but the rest are fine. I also have to check my recirc vent, which I have no idea what to look for and where ?
Thank you all for your input and the reminder to check pressures with RPM above idle. She Who Must Be Obeyed and I took a nice Sunday drive to experience some of Maryland's covered bridges in the Catoctin Mountains. The AC was deemed to be working at the required level and I have not touched it.
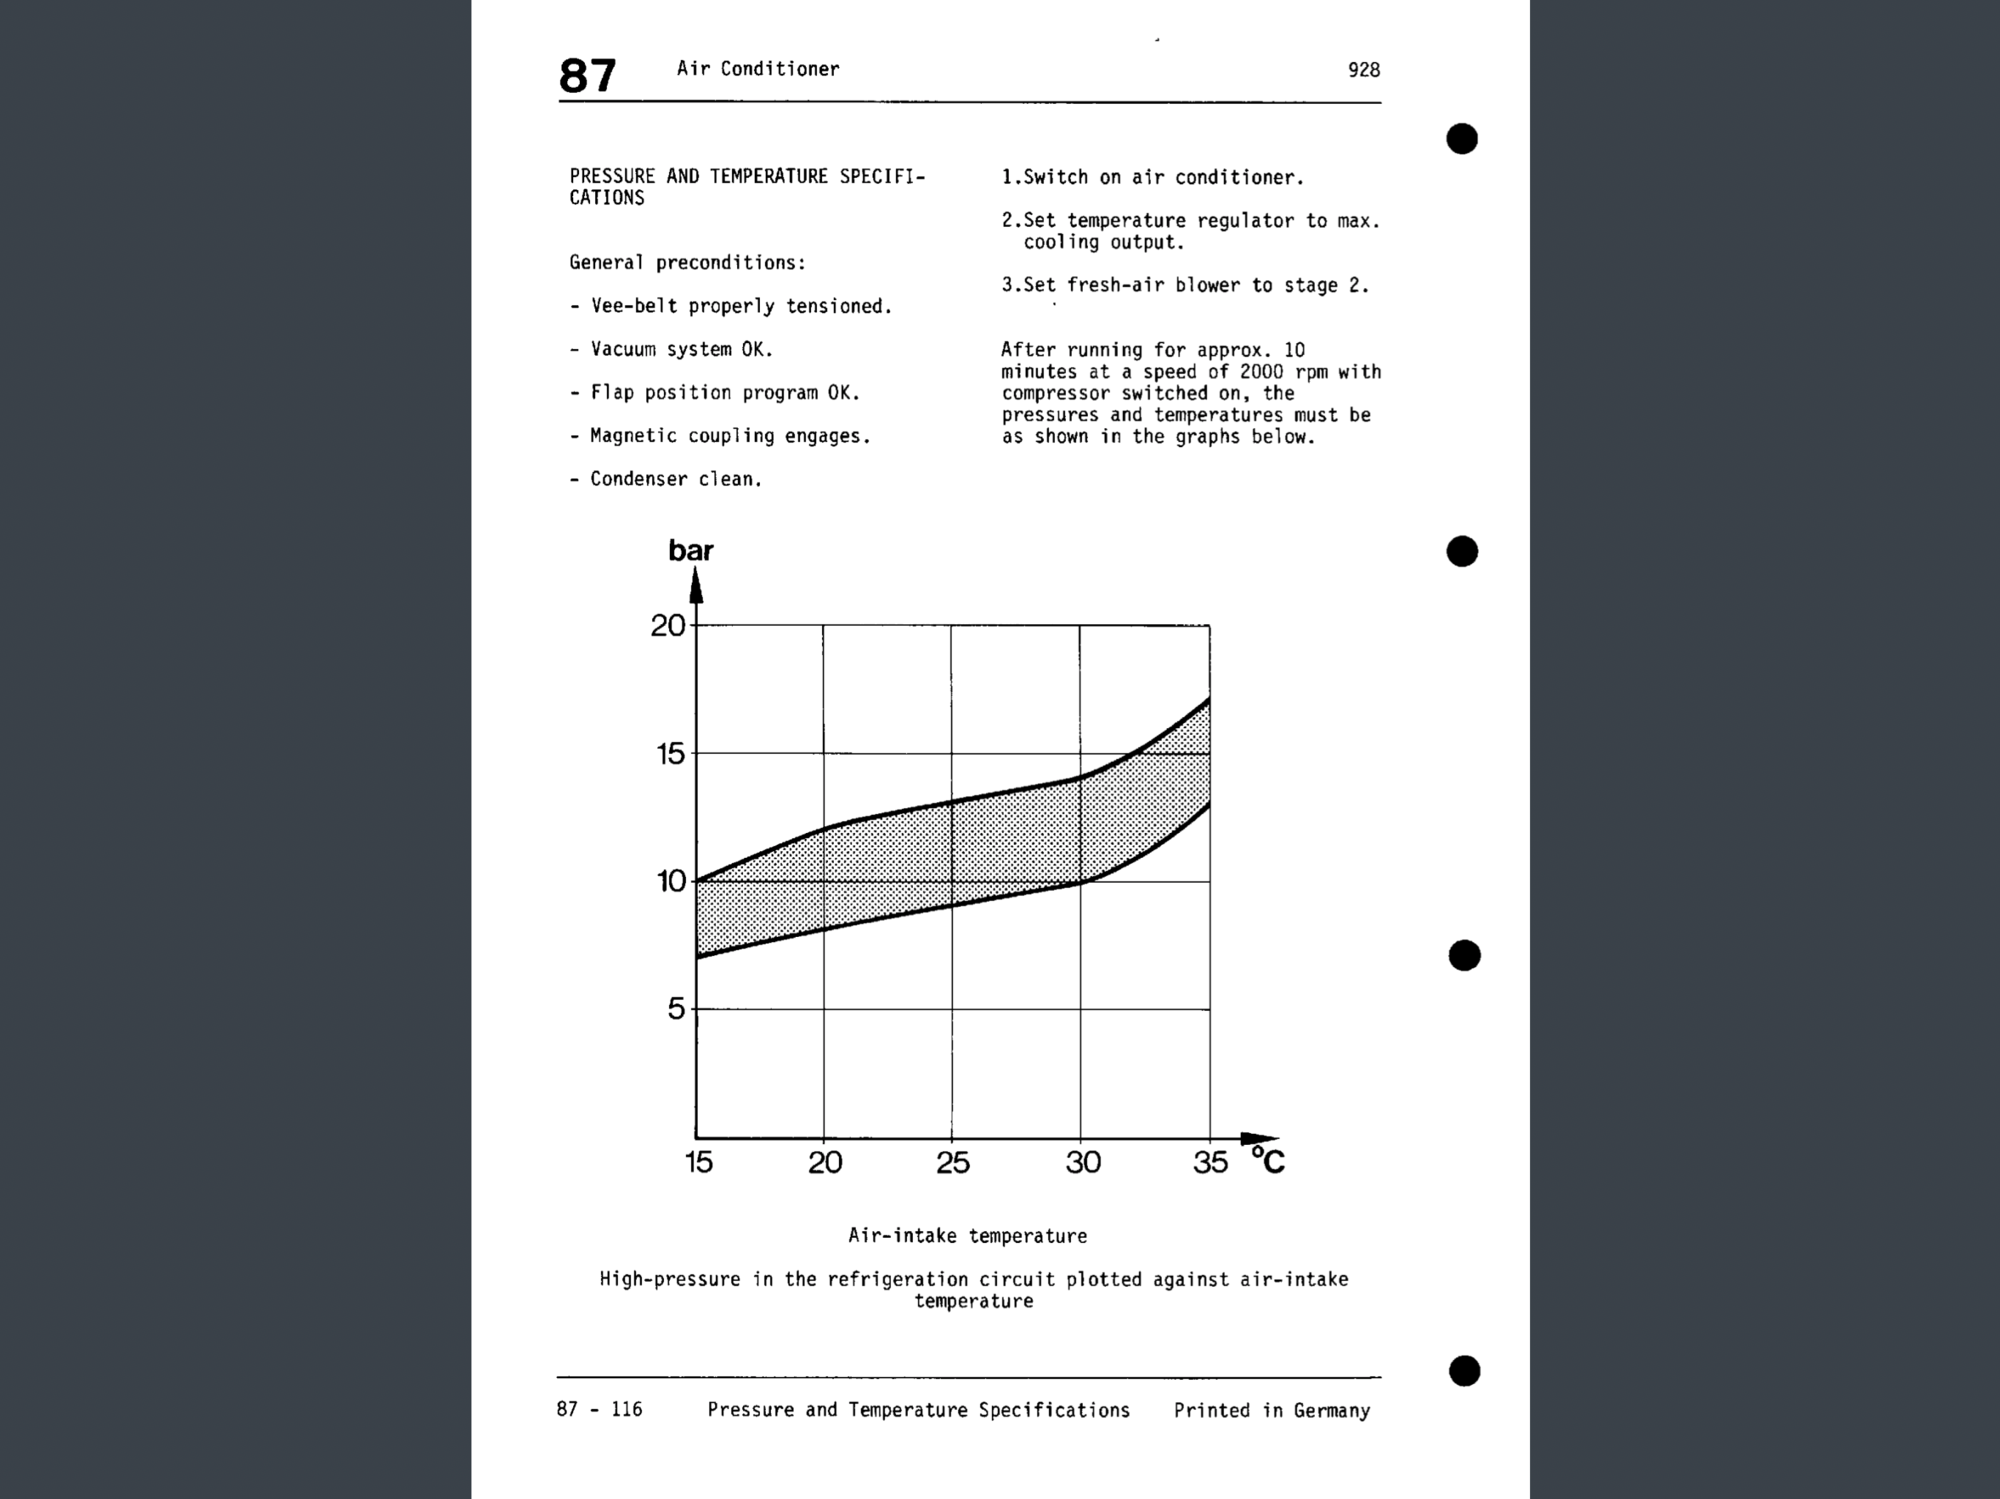
Andre; It is my understanding that the chart you found, which is pretty much identical to the one I use, is derived principally from the qualities of the particular refrigerant and the immutable laws of thermodynamics rather than the characteristics of a particular vehicle. The WSM chart is better, but the generic chart will get you in the ballpark. If I am wrong about this, I hope someone will chime in.
Thank you all for your input and the reminder to check pressures with RPM above idle. She Who Must Be Obeyed and I took a nice Sunday drive to experience some of Maryland's covered bridges in the Catoctin Mountains. The AC was deemed to be working at the required level and I have not touched it.
Andre; It is my understanding that the chart you found, which is pretty much identical to the one I use, is derived principally from the qualities of the particular refrigerant and the immutable laws of thermodynamics rather than the characteristics of a particular vehicle. The WSM chart is better, but the generic chart will get you in the ballpark. If I am wrong about this, I hope someone will chime in.
The description of “creamy with no bubbles” is contradictory. The refrigerant stream is clear with thin slivers of oil in the liquid. “Creamy” is the same as “large fraction of entrained vapor”, technical language for “bubbles”.
While it it might be simple to just add refrigerant until there are no bubbles, the mass of refrigerant needed to get there varies widely as ambient and cabin conditions change. We use gauges to monitor system conditions against those ambient conditions. High condenser pressure can point to poor airflow, high ambient condition In both the cabin and outside. Suction pressures are determined by compressor performance as well as by charge mass. Along with cabin temps and humidity, fan speeds, and a properly functioning expansion valve. A perfect system has suction pressures low enough to freeze the evaporator, generally less than 30 psig. There’s enough condenser performance and airflow to get liquid to the expansion valve at the lowest possible condensing pressure and temperature. Easy to do when it’s cool outside. So testing pressures while it’s 70 and seeing bubbles at 1500 rpm tells me there’s air in the system, it’s undercharged, the compressor isn’t working well, perhaps the expansion valve is sticking. The Big Test is whether you can keep your fun barometer cool and happy on a hot day in Hell.
Fixed pressure charts don’t really apply to automotive systems. They assume constant compressor speed and fixed orifice between high and low pressure. They also assume a fairly narrow range of air temps across the evaporator. They are pretty accurate with refrigerators and most home air conditioners.
Cars use expansion valves, will run air above 100 degrees in summer and below freezing in winter across the evaporator (during defrost) and compressors that run at various speeds.
Weight is the only true method to get the right charge in this type of system. With R-12, the sight glass is pretty close, with 134, only by weight.
Fixed pressure charts don�t really apply to automotive systems. They assume constant compressor speed and fixed orifice between high and low pressure. They also assume a fairly narrow range of air temps across the evaporator. They are pretty accurate with refrigerators and most home air conditioners.
Cars use expansion valves, will run air above 100 degrees in summer and below freezing in winter across the evaporator (during defrost) and compressors that run at various speeds.
Weight is the only true method to get the right charge in this type of system. With R-12, the sight glass is pretty close, with 134, only by weight.
To write that the �Fixed pressure charts don�t really apply� indicates that you have not read the WSM and do not know the operational context in which they are both applicable and correct.
I was referencing the chart Andre posted earlier, not yours. That one is pretty specific on pressures, and using it a person can charge a home a/c system pretty accurately.
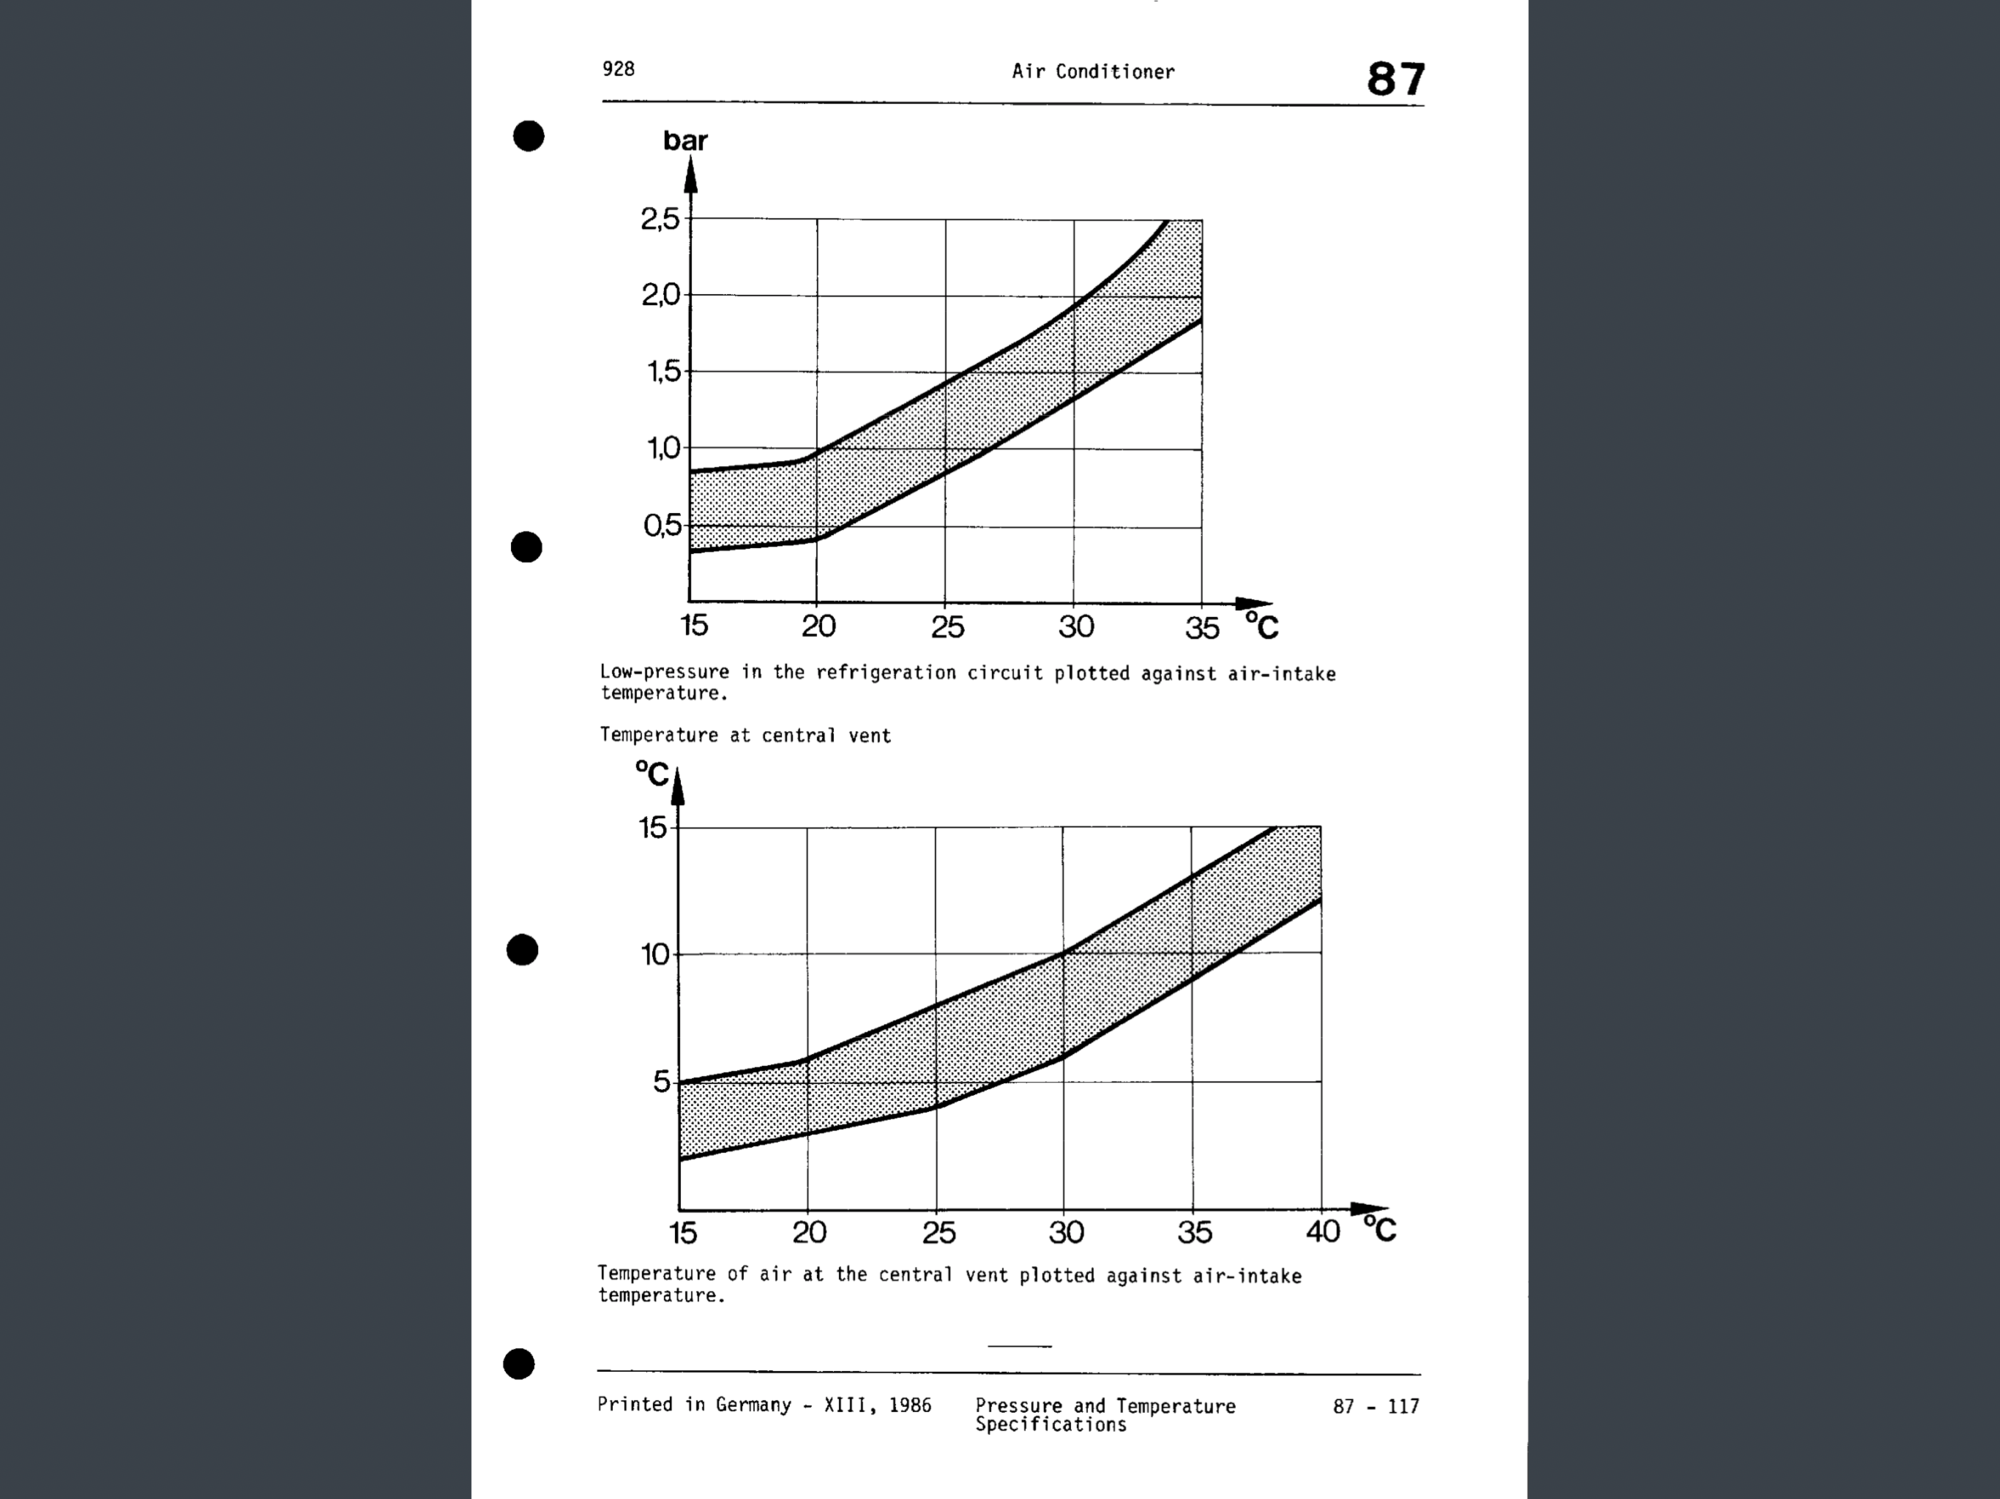
If you notice, on your chart there is about 3 Bar (40psi) range on high side and .5 bar (7psi) range on the low side, so it is certainly not a fixed pressure chart. While this chart will tell if the a/c is functioning within acceptable limits, this is not a guide to charging the system. Weight is.
And I have read the WSM.
Last edited by Billu; 10-14-2019 at 11:07 PM.
Reason: Change
The WSM charts are a good guide to deciding if system performance meets original expectations. But, as shared in many of these posts, there are many variables that move the temperatures and pressures around within the chart ranges. I suspect that they were also pretty handy for dealers explaining to folks that the system [under-] performance they were seeing was actually OK.
Looking for liquid and bubbles in the sight glass applies just as much to R134a as it does to R12. With R134a though, charging to eliminate bubbles is dangerous, as the temperature vs. pressure curves spike up hard at ambient temps above about 90�F with a hot cabin. Looking for foam or bubbles tells you only what's happening under those instant conditions. You need the pressure/temperature values at the same time to decide where the system actually sits on the charts.


 07-10-2018, 05:17 PM