When you click on links to various merchants on this site and make a purchase, this can result in this site earning a commission. Affiliate programs and affiliations include, but are not limited to, the eBay Partner Network.
Motec i2 Pro & Standard - user tips, tricks & silly little questions
It seems there isn't a consolidated thread for i2 users to share the many tips and tricks we find ... or can't find dammit! .. as we work through our data.
Also I find the Motec forum is a bit messy.
... so here's the silly little question thread for Motec i2 Software.
The idea is either post questions on little issues re the user interface/GUI, data management, importing math channels, setting up custom guages, syncing with video etc...
The thread isn't really for analysing data ...
the Pro are gladly all on the 'Ask the coach' thread and that's system agnostic ...
this is just a place to keep various little tips and clever ideas that are specific to i2.
Also with the recent new release of v1.1 there are some nifty/tricky changes that are nice to point out as you find them.
As Math channels are NOT transferred automatically there'll be some work to find the easiest/simplest way to move those across to the new 1.1 workbooks.
Hopefully some more to post on that soon ...
So to kick it off... Here's a trick I just found: Quickly add lines to charts
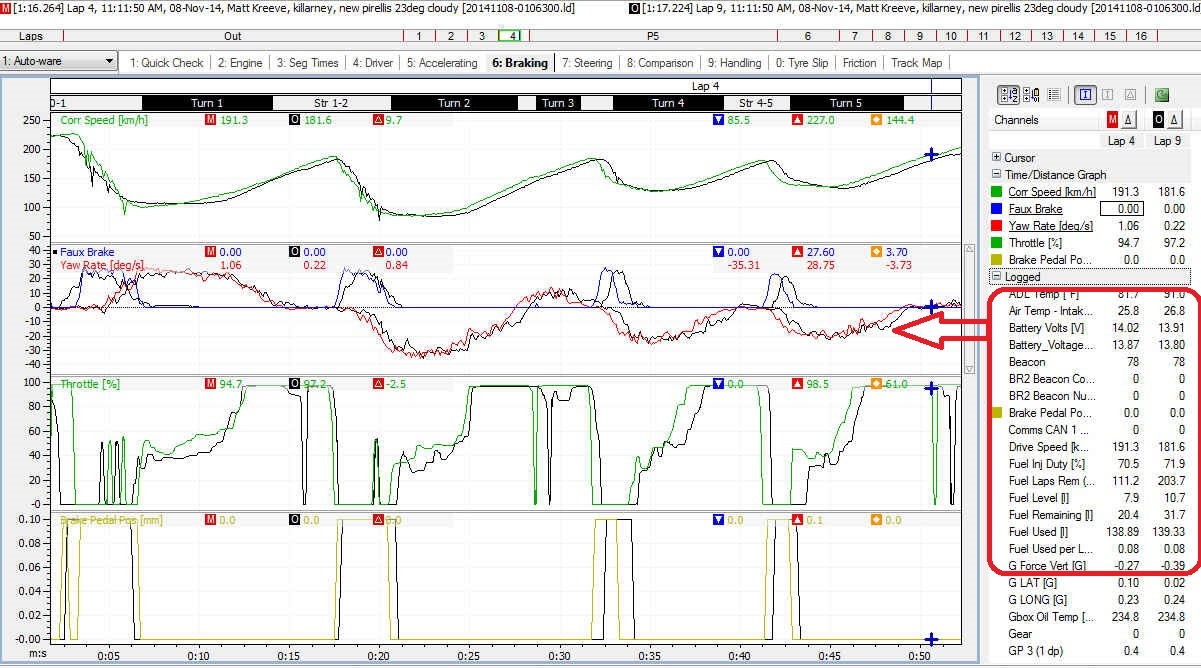
The values window (toggles with [V] key) is the one to the right of the picture below.
It's quite useful and while similar to the channels window, it clearly also shows spot values.
Neat trick I just found (might not be new to the seasoned users) is that you can just drag an item from the V-Win
to the chart you're using and it adds it to the pane you drag to ... a little time saver and neater than selecting the pane you want, opening the channel window, clicking etc...
And to remove it, just click on the colored square next to the item name in the V-window.
another neat trick I found today ...
often charts can get messed up or 'too squiggly' when new channels are added
and then you're messing with your original 'key' metrics ie Speed, RPM etc
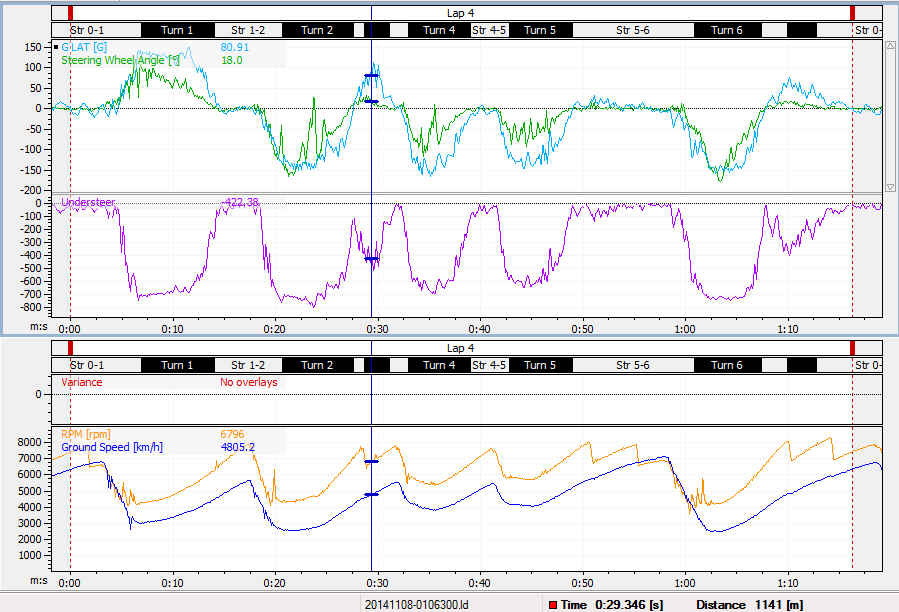
... so rather than make one chart object in a workbook ... make two
ie one below for the regular metrics setup and scaled as you like it
and one above for the ones you're investigating
this way as you change and explore the idea (eg understeering) you can modify the top chart
and keep a well setup rpm, speed etc.. like it is and likely how you use it on multiple pages
all you have to do is add the first one, size it with the resizing cursors
and then add the second one ... or even just copy/paste it from another worksheet
thanks Jerry .. is your theory that racers get data drunk in Winter?
No it's mid summer down here .. but tracks are closed and cities quiet as the beach trade booms.
... so effectively winter for racers (between canyon trips).
Good time to spend tweaking your sheets and syncing vids from 2 or 3 of your best sessions
thanks to data guru Peter Krause for this gem ... some great braking insight along with i2 formulae
and a neat way to display it (the brake aggression metric)
Brake aggression metric can be compared corner to corner, track to track. If you can do it once, you can do it again... LOVE the fact that you can put a quantitative number to qualitative execution...
__________________ -Peter Krause www.peterkrause.net www.gofasternow.com
"Combining the Art and Science of Driving Fast!"
Specializing in Professional, Private Driver Performance Evaluation and Optimization
Consultation Available Remotely and at VIRginia International Raceway
Brake aggression metric can be compared corner to corner, track to track. If you can do it once, you can do it again... LOVE the fact that you can put a quantitative number to qualitative execution...
We're talking about putting a number to how quick the brake pressure comes up and how high it gets in a given distance.
There are places where you CAN'T quickly and aggressively apply the brakes, like for T3 at Road Atlanta. But there are a lot of places where, because drivers can't see though the corner or they don't have a VERY clear idea of EXACTLY where and how much they're going to brake that they're lazy, equivocal or just not consistent with "best practices" on quicky and maximally applying the brakes.
There are course conditions and track surface conditions that can affect this, and coupled with an examination of the wheel speeds to search for lockup, you can "tune" your application of the brakes FOR THOSE conditions... Then, assign a brake aggression number to that execution and check to make sure you're doing it EVERY lap.
There is a math channel for throttle aggression, which has an optimal value for each corner, and brake release smoothness, too.
With MoTeC, you'll NEVER run out of ways to optimize your driving, especially in a powerful car...
Brake aggression metric can be compared corner to corner, track to track. If you can do it once, you can do it again... LOVE the fact that you can put a quantitative number to qualitative execution...

 12-21-2014, 04:39 PM