


Matt Romanowski
October 14, 2022
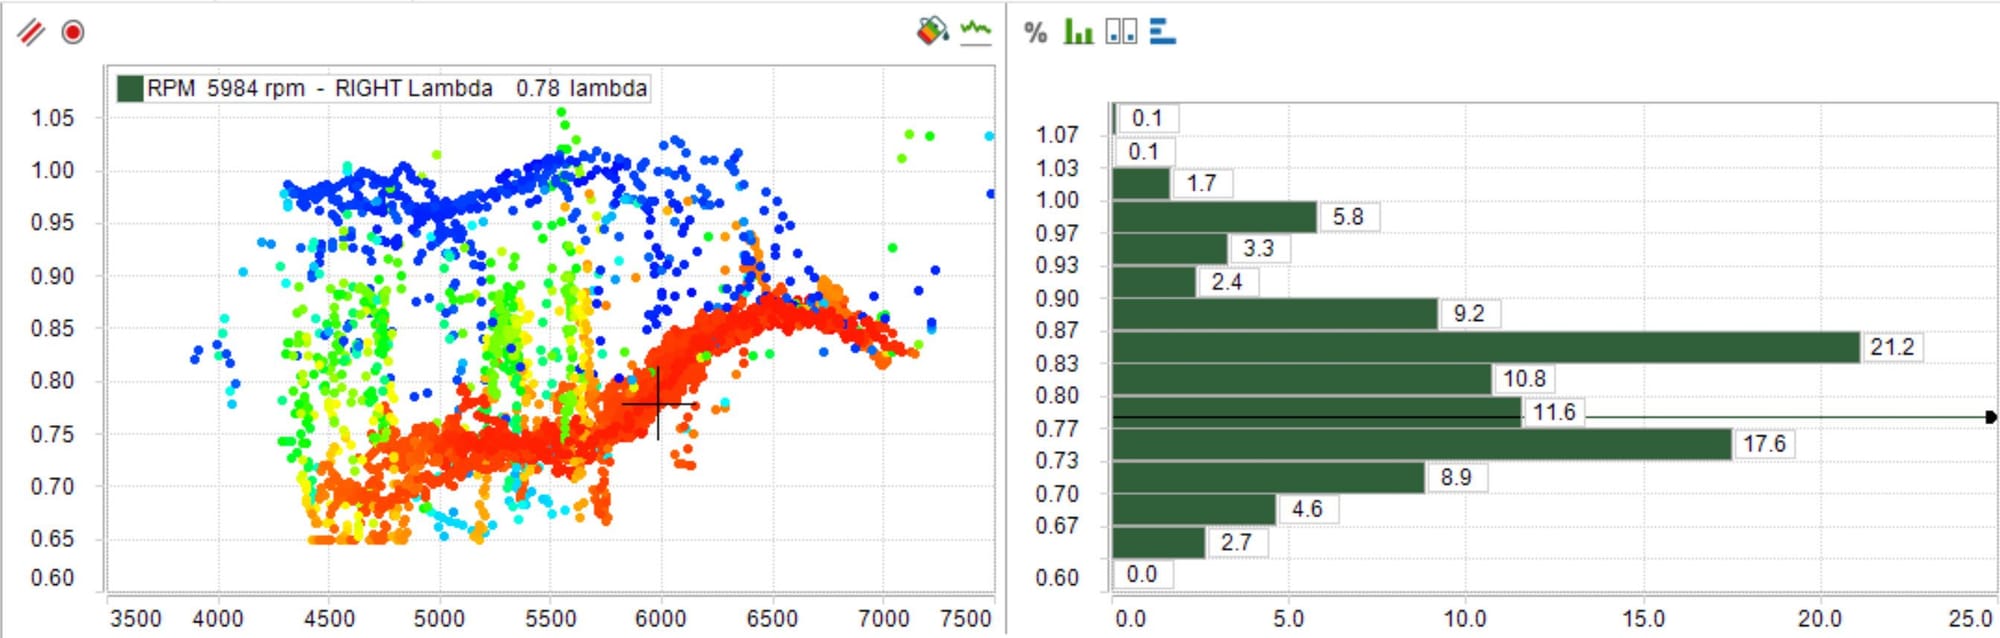
Scatter plots showing lambda vs. RPM colored by TPS. The histogram is a simple tool to see where in the range you are running the most.
More About This Picture
Vehicle
N/A
Location
N/A
Keywords
N/A
Discover More Pictures
See More


Advertisement
Be the first to comment on this picture!