When you click on links to various merchants on this site and make a purchase, this can result in this site earning a commission. Affiliate programs and affiliations include, but are not limited to, the eBay Partner Network.
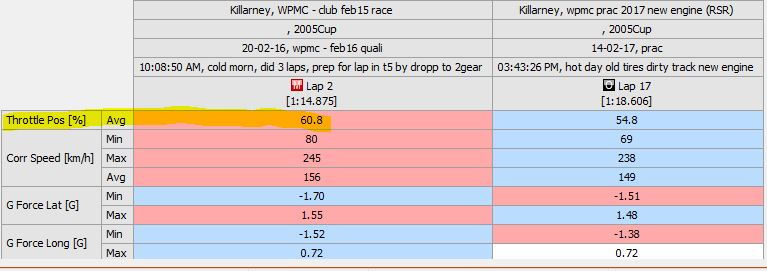
I'm back on this same problem - as TEDean pointed out above, the number I was looking for (ie % of time at full throttle or full brake) is shown in the channel report from i2 as shown below
Now I just want to access that single number ie the %throttlefull as highlighted without calling up the whole report ... is there a way t use the maths function (i'm on i2pro) or a way to reference that single data point?
One question for you. What do you define as "% of time at full brake?"
__________________ -Peter Krause www.peterkrause.net www.gofasternow.com
"Combining the Art and Science of Driving Fast!"
Specializing in Professional, Private Driver Performance Evaluation and Optimization
Consultation Available Remotely and at VIRginia International Raceway
I'm not sure I totally understand your question. You could create a math channel for the integration of the throttle channel when greater than 95% (or whatever amount you choose). That will give you a graph that you could take the end value or get it in a report.
One question for you. What do you define as "% of time at full brake?"
Hi Pete - thanks and yes that is the question but my brake pos sensor is only binary - need to make that a better sensor before worrying about that specific question
Originally Posted by Matt Romanowski
I'm not sure I totally understand your question. You could create a math channel for the integration of the throttle channel when greater than 95% (or whatever amount you choose). That will give you a graph that you could take the end value or get it in a report.
Hey Matt - thanks for pitching in ... the issue with the |Ave| number given by the report is that while it is instructive, it doesn't actually show the % of time the throttle is above 95 or 97% .. thanks for that pointer re integrate
the issue with the |Ave| number given by the report is that while it is instructive, it doesn't actually show the % of time the throttle is above 95 or 97% .. thanks for that pointer re integrate
So, you'll need to make a channel similar to this (courtesy Jorge Segers):
Calculating a conditional time:
Example: Full Throttle Time
I think an easier way is outlined by Bob Knox in his book and by John Block in his webinars. In a bit of a thrash for awhile forward but search in the DAQ sub forum as this was discussed at length and the AiM and MoTeC syntax are in there, IIRC.
I use this as a comparison to determine if drivers are in fact improving and when he driver is capable of doing three to five laps within low tenths to high hundredths apart, whether setup changes have in fact improved the car, by objective measure...
I didn't look, but Bob probably has a version of this in his book for MoTeC. I think that the formulas in his book are one of the best parts. They are very helpful to understand how the math channels really work.
I agree Peter's use of the channel. You have to have great consistency before this measure is really useful. GIGO.
As a note, for any measure, you can take the total value and divide it by the lap integral to get a %. You could use this for lots of things. % of lap with the wheel turned, % of the lap for various engine measures, suspension movement, etc. It's a great lap metric tool.
This channel integrates a channel with a constant value of 1 against time only when the specified condition (throttle > 95%) is true.
The range_change(("Outings:Laps")) expression resets the channel back to zero at the end of each lap.
The channel �One� in this example is in fact also a math channel defined as any random channel divided by itself (to obtain a constant 1).
A conditional distance is calculated using the integrate_dist command.
Are you sure this is accurate? I tried error checking by setting the condition so it was always true, and there was significant difference to lap time. Looks like the difference has to do with how the start and end points are interpolated.
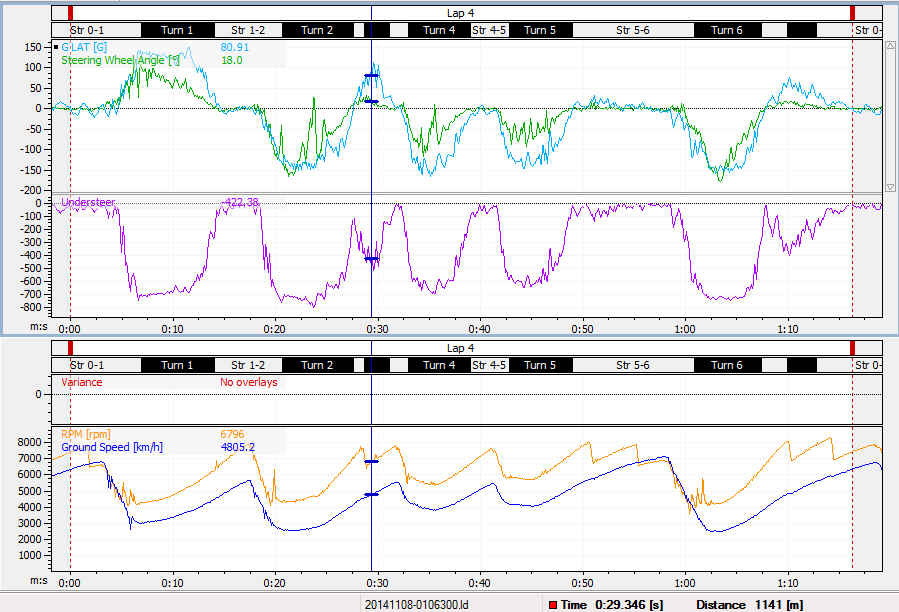
thanks Pete & Matt ... off to the track so will try implement this in between sessions ... I see your point re regularity and the value of these types of data but for me the main focus is referring to my best time (a 1:14.85) vs my normal range of 1:16-17 ... and by looking at the charts I could see the simple case of
1. being on the throttle earlier in the ref lap so RPM and throttle lines were rising easlier
2. which meant I reached full throttle earlier and for longer
and I wanted a measure of that specific area/difference, hence this question
Obviously being on the throttle sooner/quicker/further means alot of other things are happening too - line is better maybe (straightening the corner) and less hesitation to planting the right foot (ie plant it and correct and hang on (Big BB)) etc.. but I think this metric is helping me to stay focused on one major issue in quite a granular fashion .. the journey continues!
Thanks for the help!
ps - Pete can you confirm the 'One' calc trick.... do I just take dist/dist or RPM over RPM and avoid anything where it might /0?
another neat trick I found today ...
often charts can get messed up or 'too squiggly' when new channels are added
and then you're messing with your original 'key' metrics ie Speed, RPM etc
... so rather than make one chart object in a workbook ... make two
ie one below for the regular metrics setup and scaled as you like it
and one above for the ones you're investigating
this way as you change and explore the idea (eg understeering) you can modify the top chart
and keep a well setup rpm, speed etc.. like it is and likely how you use it on multiple pages
all you have to do is add the first one, size it with the resizing cursors
and then add the second one ... or even just copy/paste it from another worksheet
Sorry to necro-bump this thread but this is exactly what I'm trying to do in i2. I don't understand how to add a second "object" in order to combine 2 channels with disparate data ranges in the same group like @HiWind demonstrates above. May I have a little help, please?
Krista, please reach out to Ray Phillips at Precision Driving Analytics https://precisiondrivinganalytics.com/home His workbook creation will save you tremendous amounts of time and he supports his work very well.
Sorry to necro-bump this thread but this is exactly what I'm trying to do in i2. I don't understand how to add a second "object" in order to combine 2 channels with disparate data ranges in the same group like @HiWind demonstrates above. May I have a little help, please?
I'm not as conversant in MoTeC, but I think I have some notes on this at home if Peter can't help before Tuesday. Ping me next week and I'll try to help.
I think that I have it ... created a new channel specifically for use in overlays. Eg "overlay_brake_P" scaled 0-100. @Matt Romanowski If you have an alternative, please and thank you


 10-29-2015, 01:18 AM