When you click on links to various merchants on this site and make a purchase, this can result in this site earning a commission. Affiliate programs and affiliations include, but are not limited to, the eBay Partner Network.
I went to a new-to-me track Canaan Motor Club. It has a bunch of interesting corners and is a really good training track. Spec Miata founder Dave DelGenio created it and it's a cool drive.
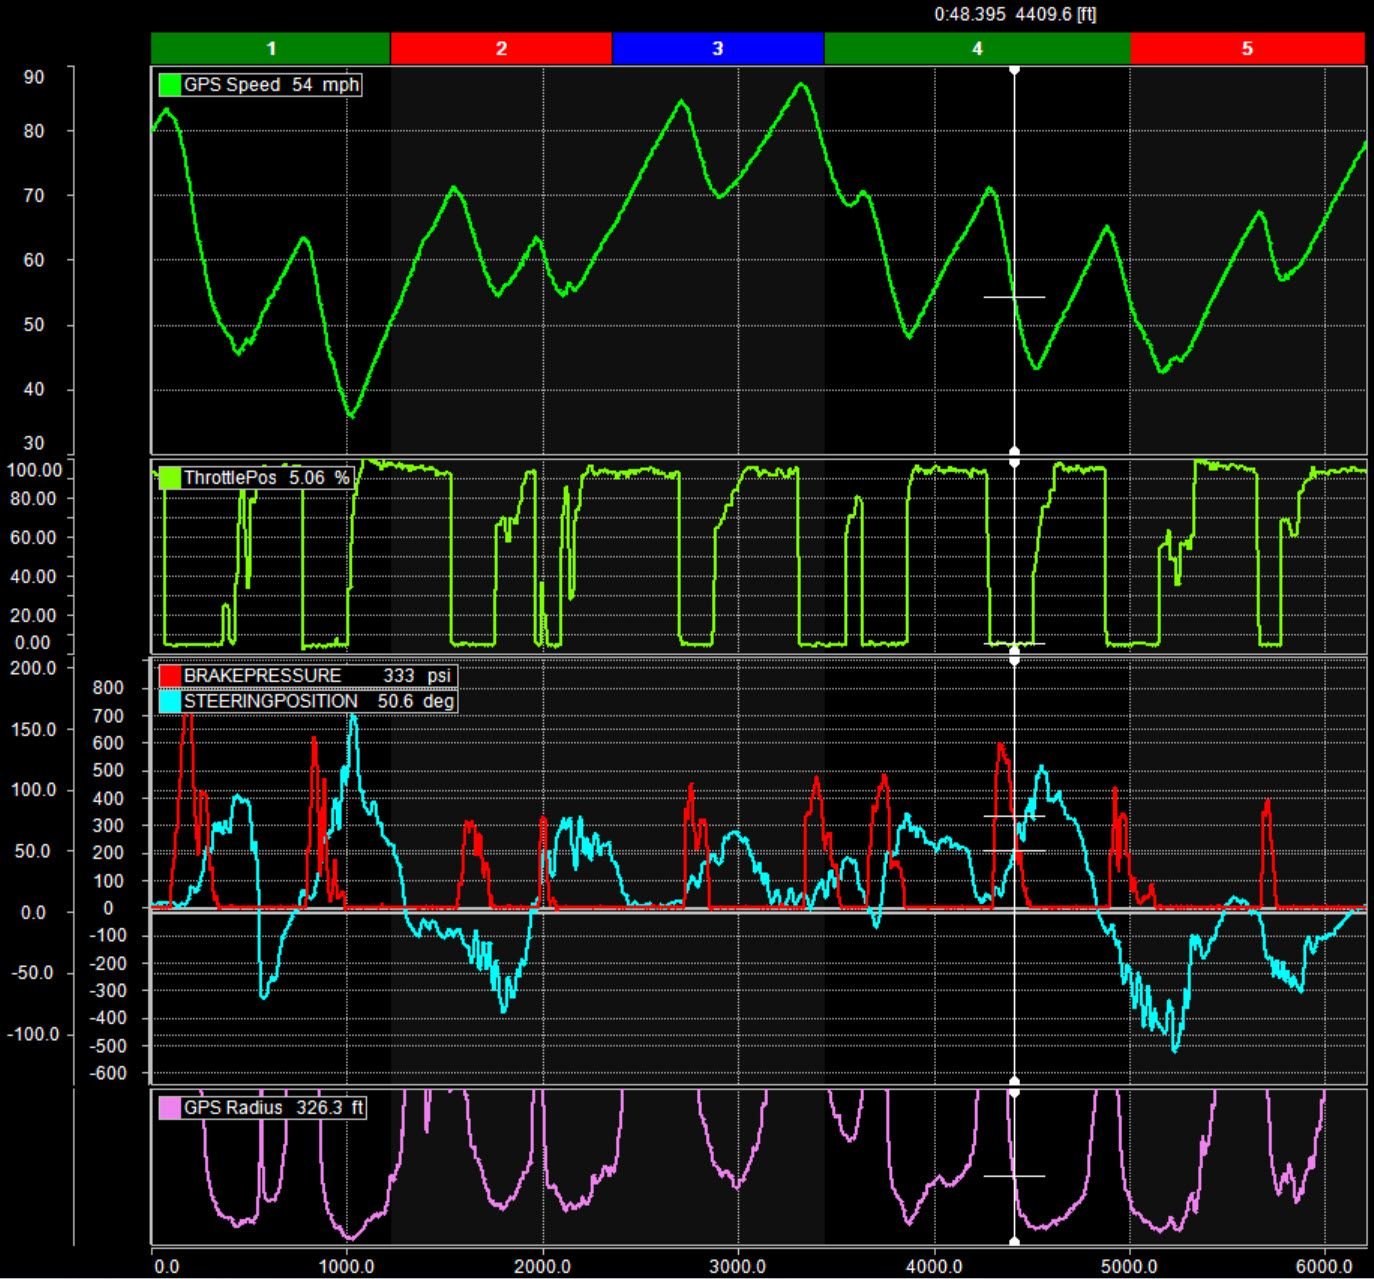
Looking at some data from the day, I thought people would like these views. Using numbered views in the time-distance plot, you can overlap data sets. I have steering and brake pressure on the same graph, so it's really easy to see brake turning / trailbraking. I also included GPS Radius so you can see if it was an early, middle, or late apex based on the driven line. When the tightest radius (bottom of the "drips") is at the beginning, it's a late apex, at the end an early apex, and in the middle, it's a middle apex.
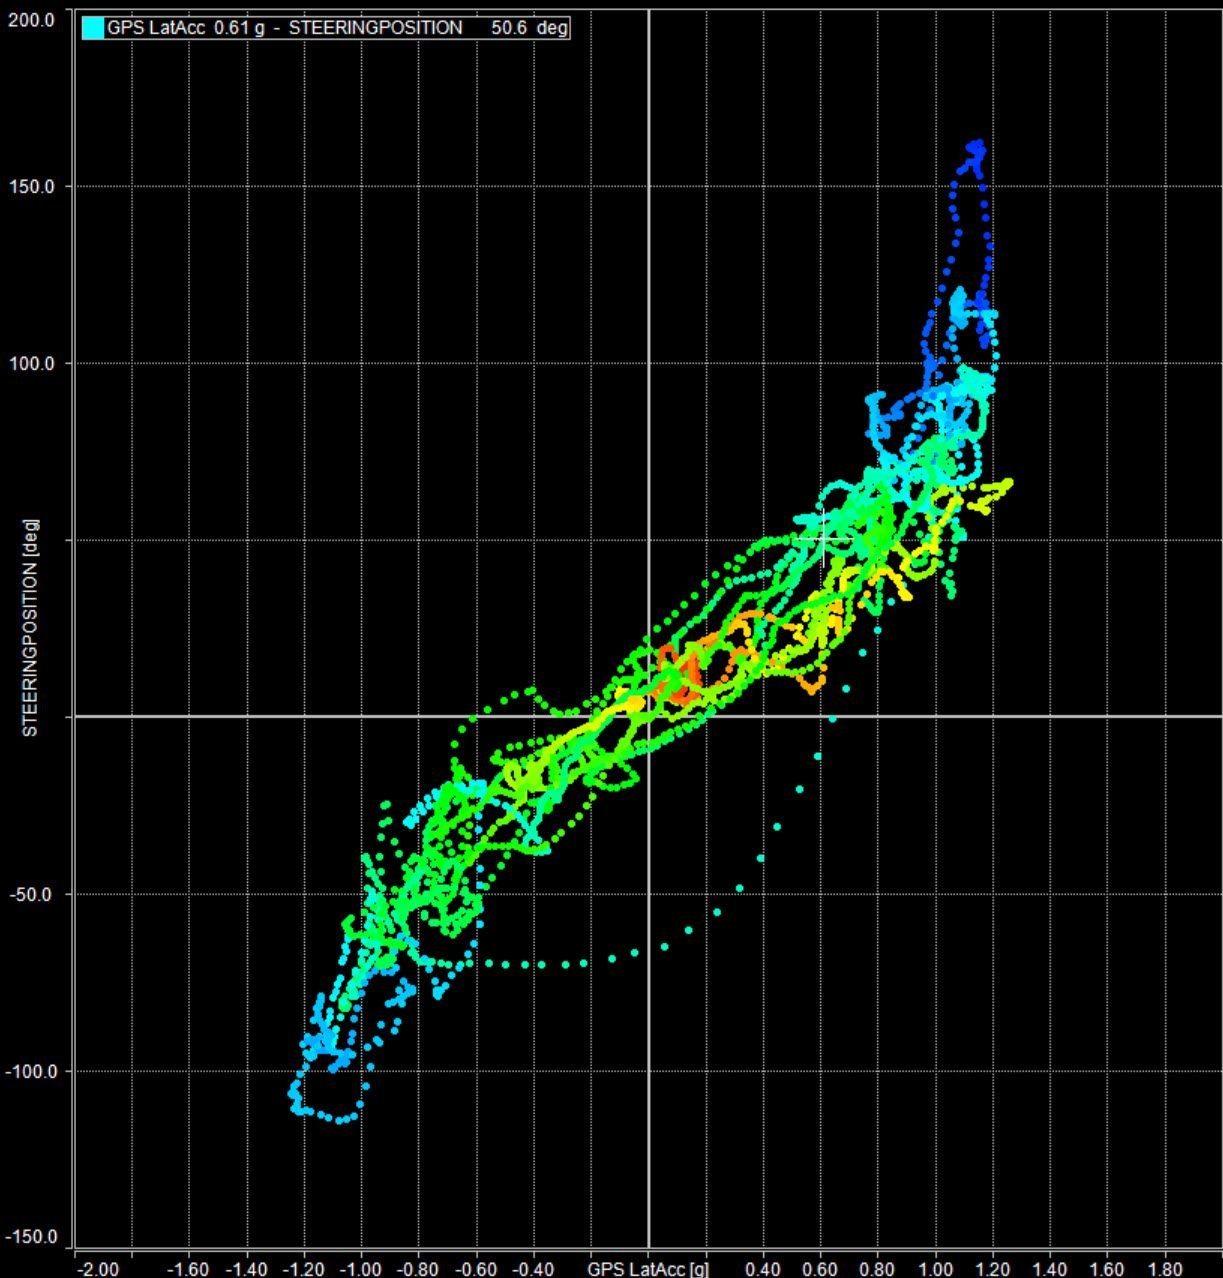
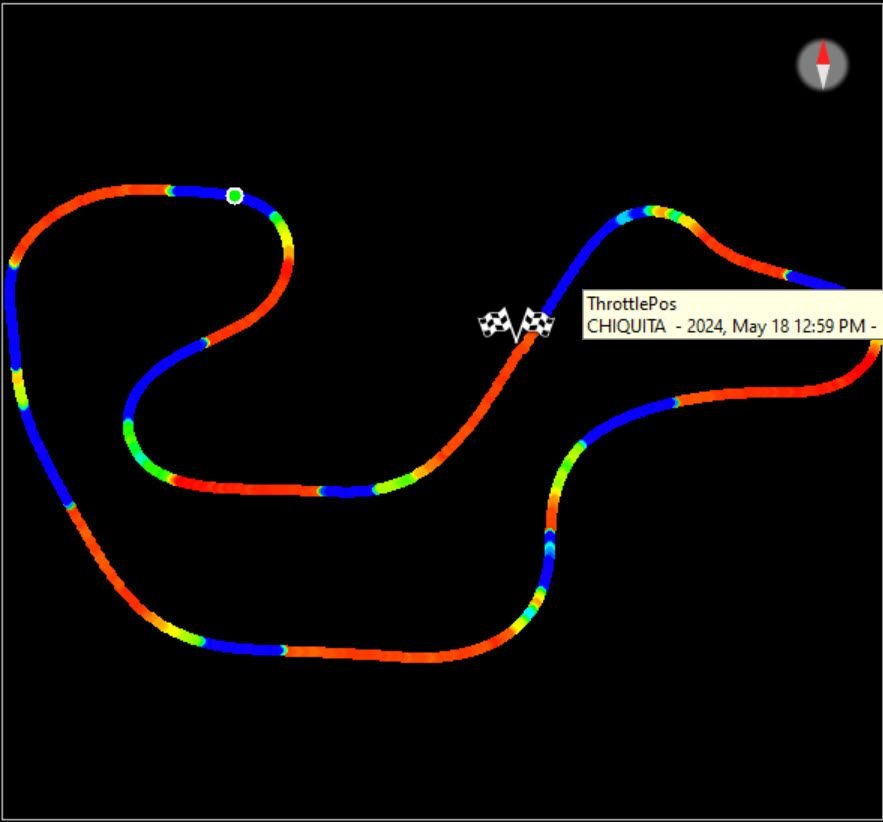
Then I have over/understeer and a driven line map colored by throttle position. Ask away if you have questions on how to make these, what they mean, or anything else.
GPS Speed on the top, throttle position in the second, brake and steering in the third, and GPS radius on the bottom.
I have an AiM MXP, but any AiM system can make these graphs provided the sensors data is there. I have a 914, so it's all individual sensors (TPS comes from the MaxxECU). Many new cars have all this data on the CANbus with a 2 wire connection.
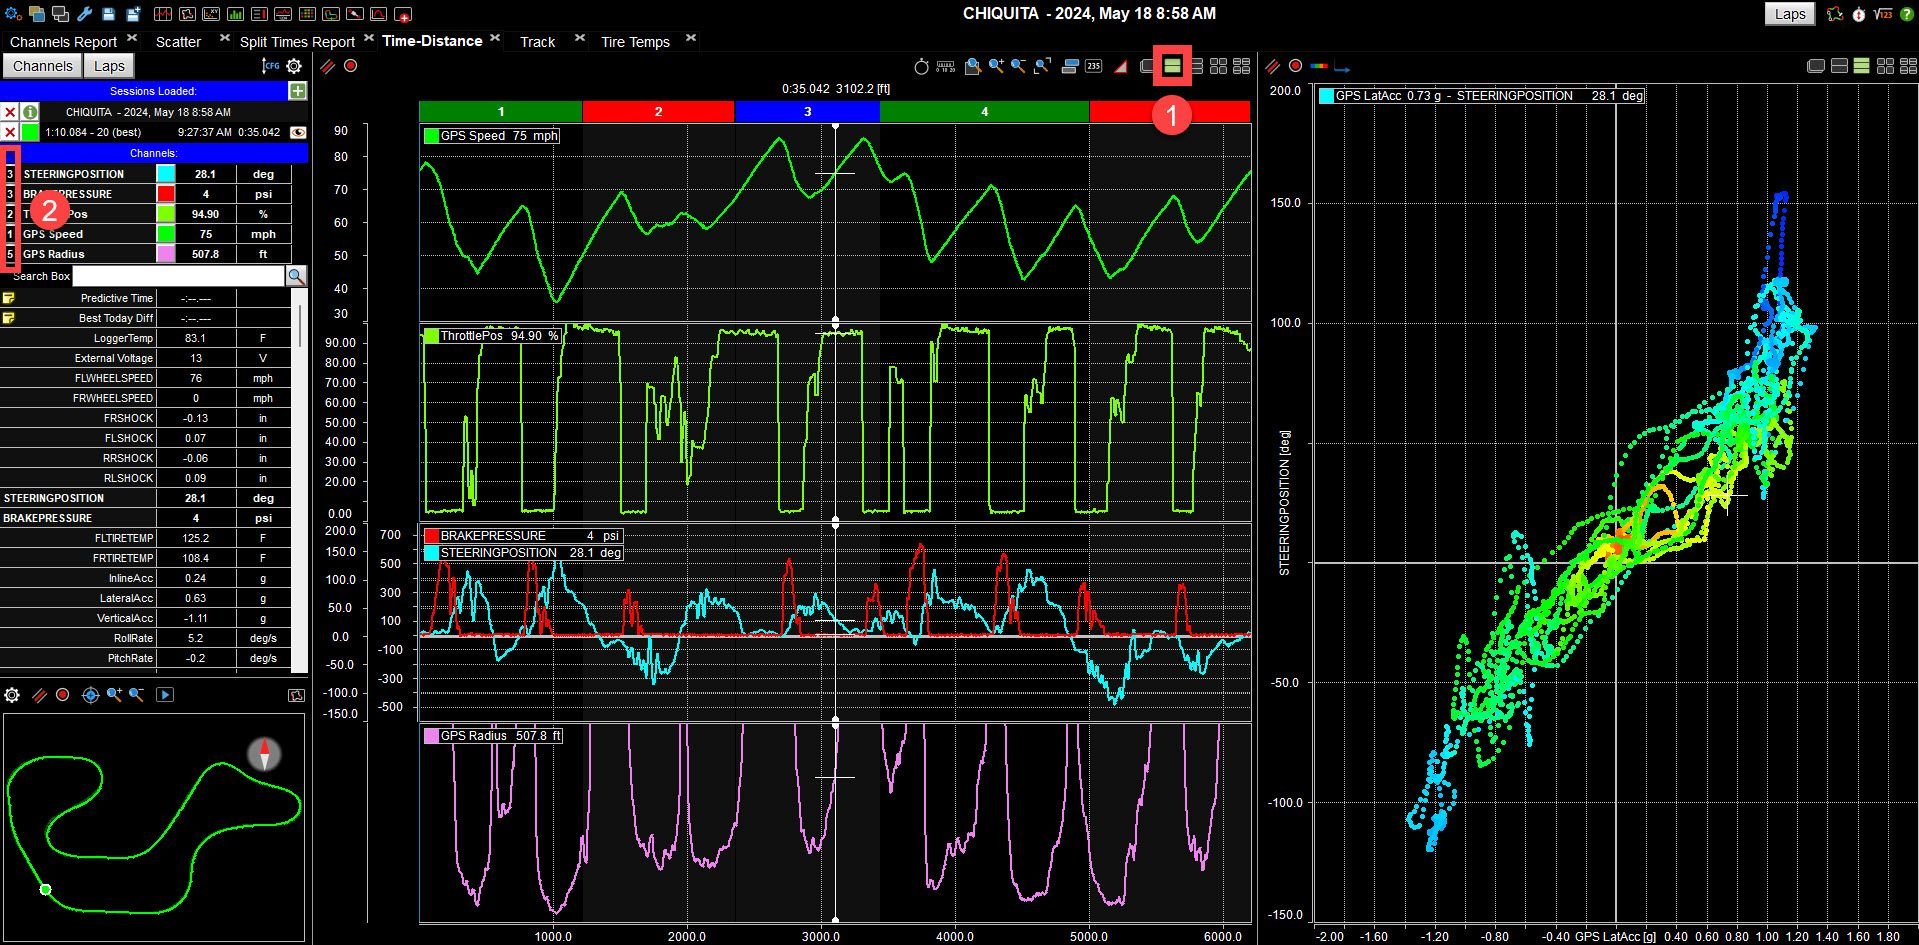
On FB, some people asked about how to stack the graphs like I did, so I thought I'd post this here too. You have to select numbered views (step 1) and then you can set the graph number (step 2) that you want. You can have up to six graphs and as many channels on each as you want.
I recently installed a vbox system. I�d love to track under/over steer. Or at least I think it would be a great idea
That can be relatively easy to do with the HD2. It can be represented in a graphic on screen, which is very helpful for drivers, and in the strip charts as a value.
This is a measure that is able to be set up in most systems after the fact but in the VBOX, it is calculated and rendered on the fly. Have PMed you.
__________________ -Peter Krause www.peterkrause.net www.gofasternow.com
"Combining the Art and Science of Driving Fast!"
Specializing in Professional, Private Driver Performance Evaluation and Optimization
Consultation Available Remotely and at VIRginia International Raceway
That can be relatively easy to do with the HD2. It can be represented in a graphic on screen, which is very helpful for drivers, and in the strip charts as a value.
This is a measure that is able to be set up in most systems after the fact but in the VBOX, it is calculated and rendered on the fly. Have PMed you.
You should start a thread and tell people how to do it - share the knowledge!

 05-21-2024, 09:15 PM