When you click on links to various merchants on this site and make a purchase, this can result in this site earning a commission. Affiliate programs and affiliations include, but are not limited to, the eBay Partner Network.
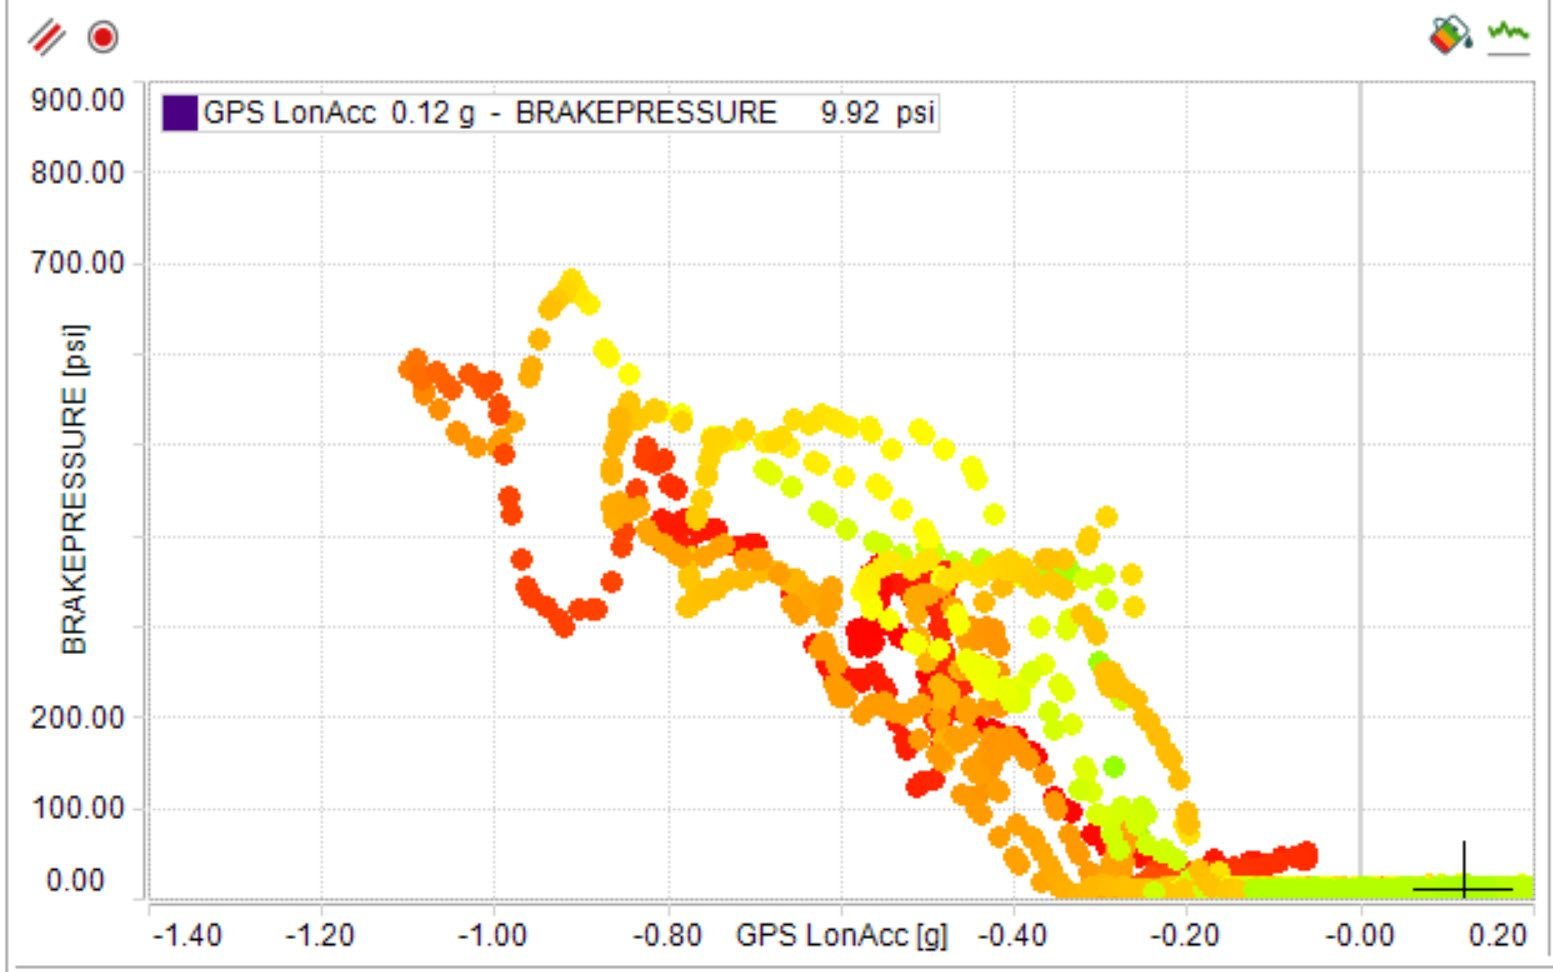
I posted this on my IG, but I thought people here might like to see it as well. A neat way to use Scatter plots is to look at brake pressure versus long G. That gives you the consistency (hysteresis) of the brake pads. You can see that you slow at the same Long G with 2 different brake pressures. This is usually the heat sensitivity of the pad. You can also color the friction circle by brake pressure or any other sensor that you have. It's a really powerful way to look at some data.
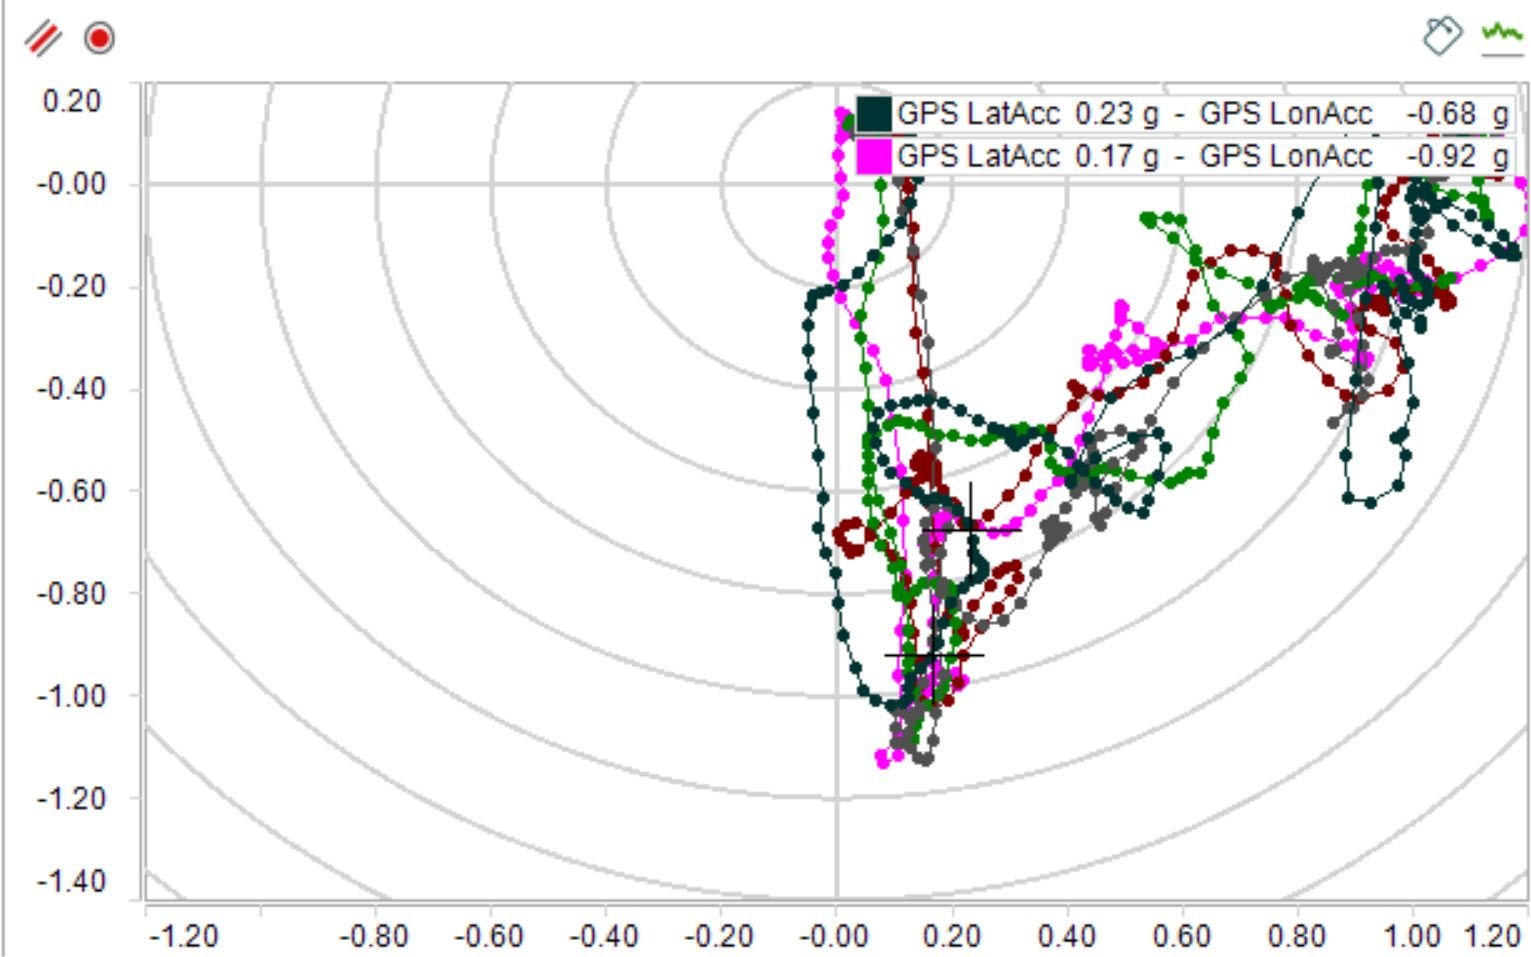
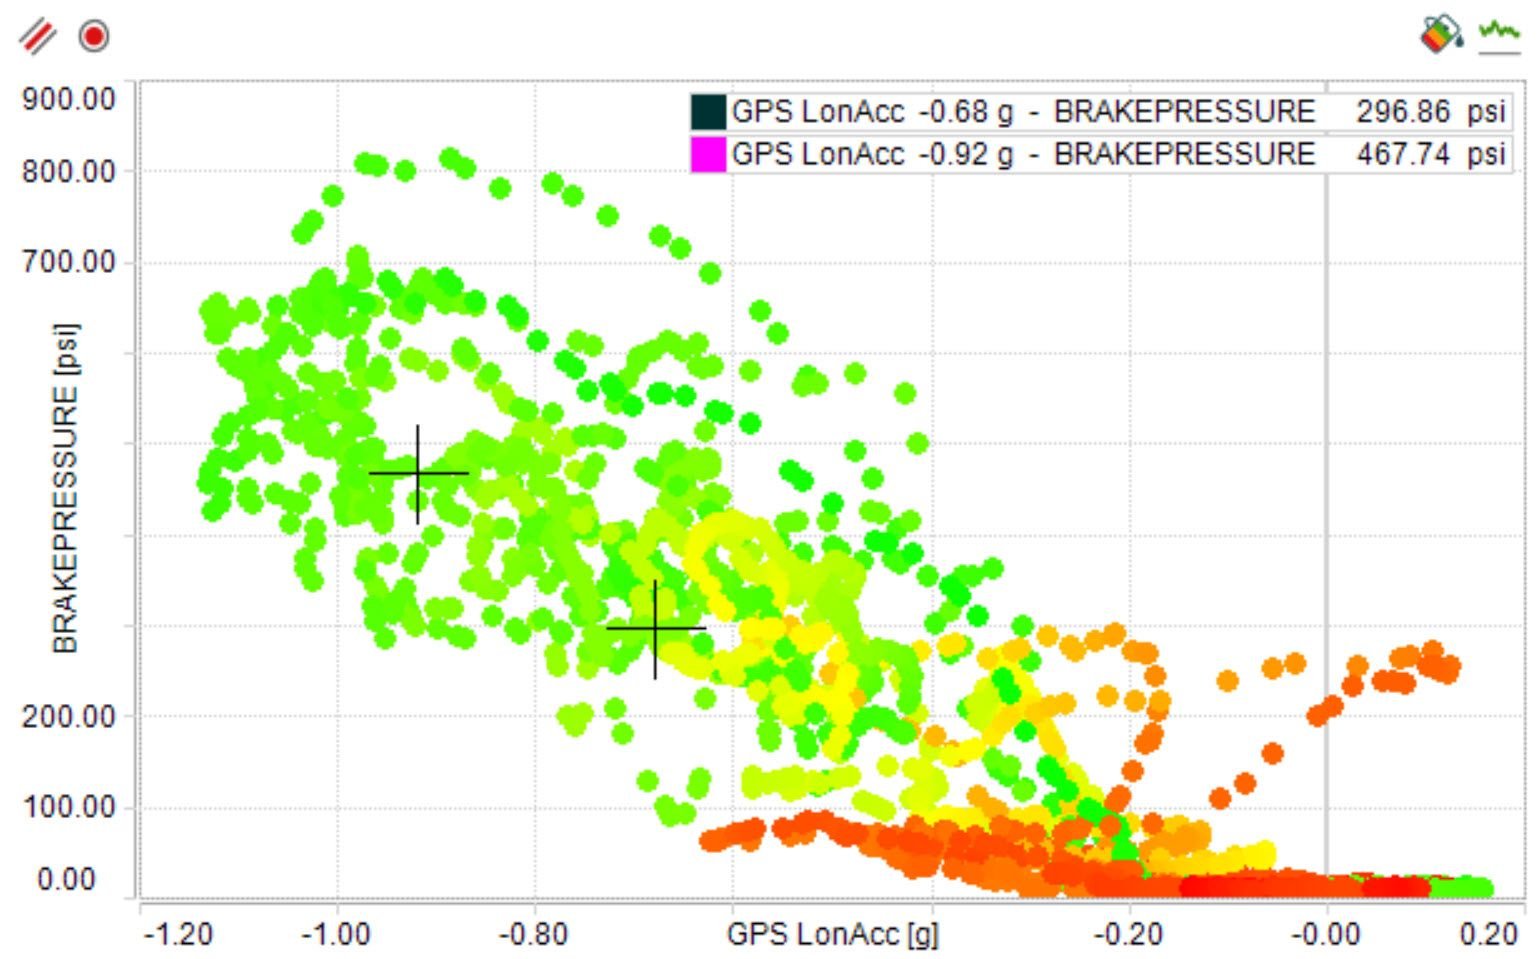
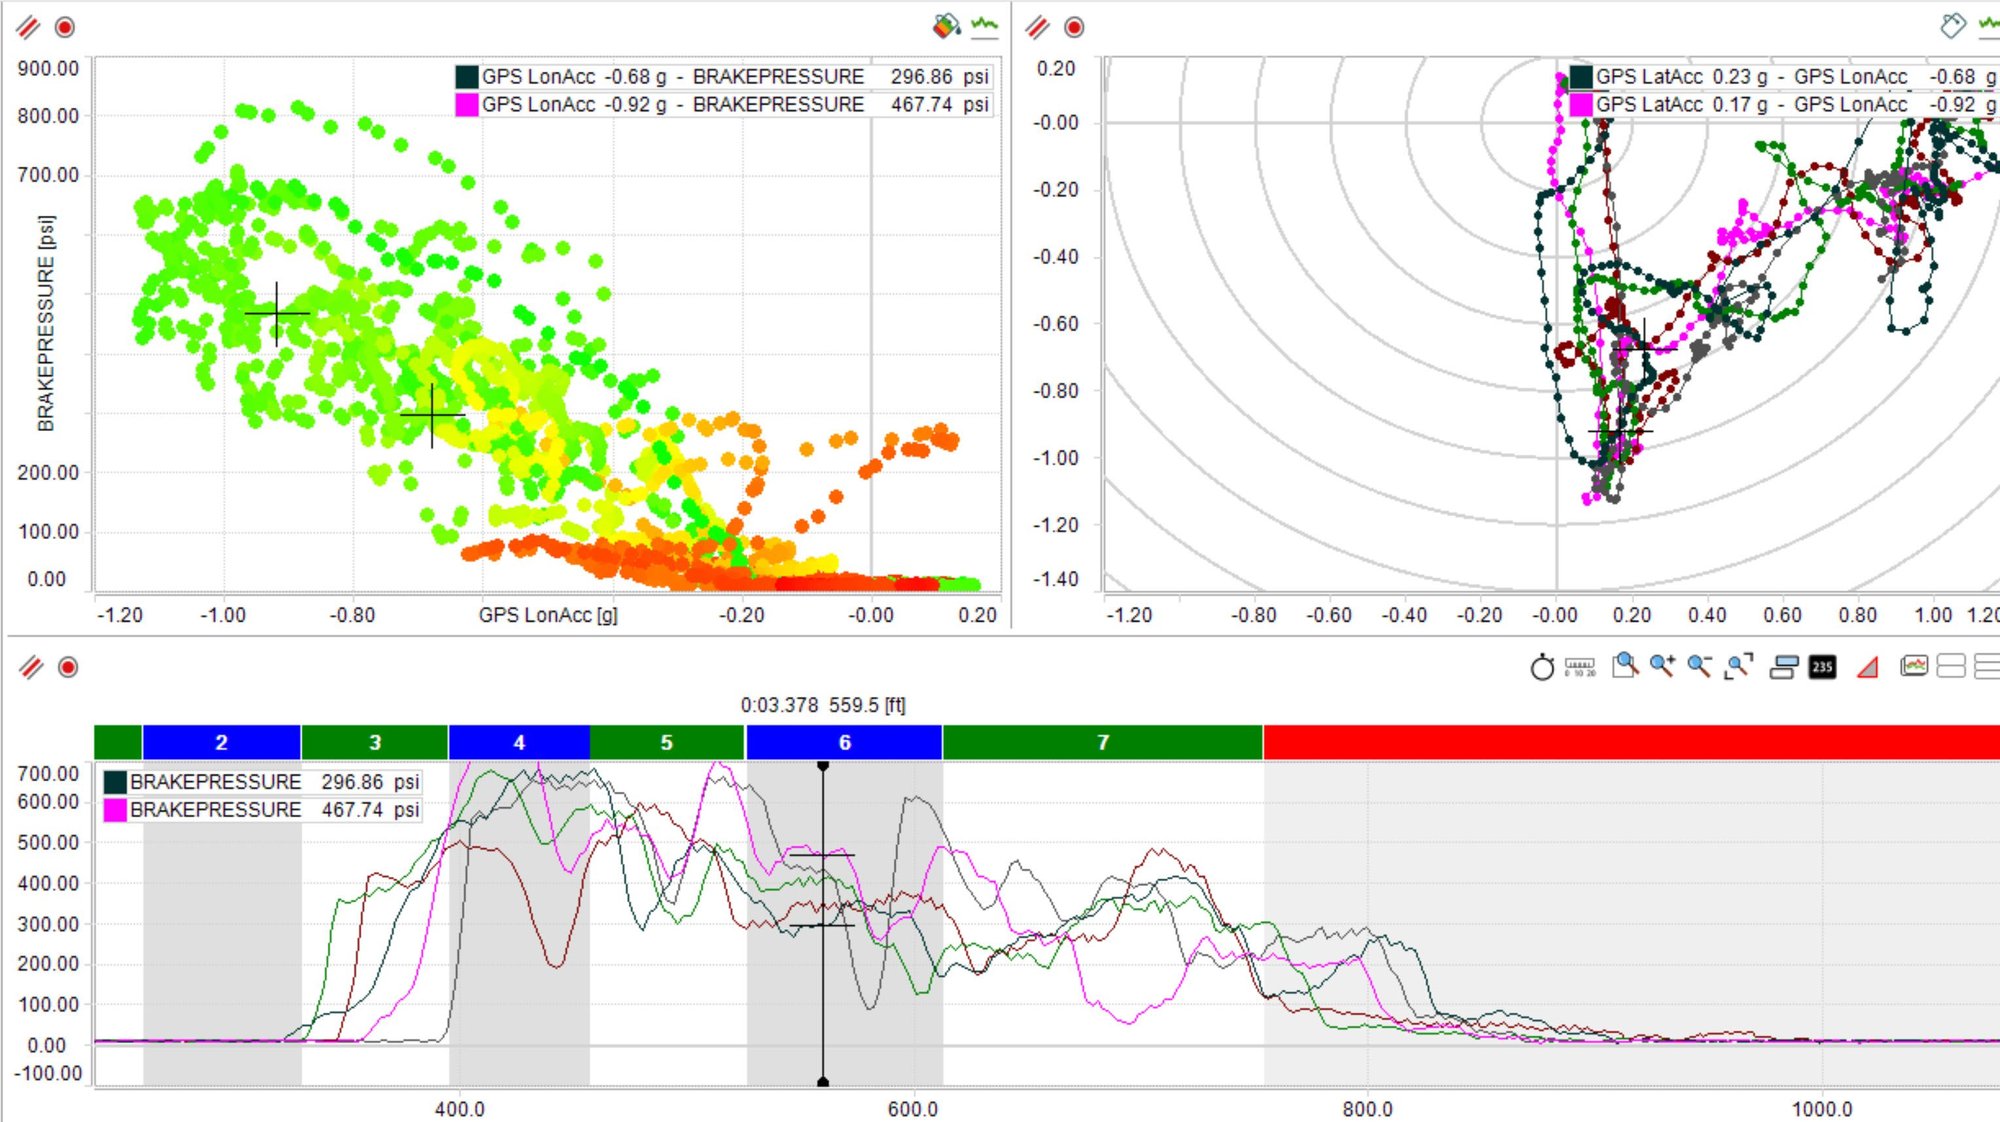
Brake Pressure vs. Long G colored by Temp. Friction Circle for just this brake zone/corner. Brake Pressure vs. Long G colored by Lat G. The whole profile in RS3 Analysis.
These are great @Matt Romanowski One thing I've found worth considering when interpreting these kinds of x-y plots is what else is going on. In this case you might find that both speed and gradient also affect this brake pressure verses long g plot. As you're using AiM you can correct your long g slope effect with a maths channel. The maths for that is linked below but I think you've seen this already.
The other thing is speed. So often the faster you go the more drag you have which effects your deceleration - you might find you can get more deceleration for the same brake pressure application simply because you're going faster. The friction circle is really a g-g-v plot ... ie. your lateral and longitudinal g potential changes with speed. Each car is different so I've found it worth keeping an eye on this. For example a "non-aero" car or kart can have a pretty linear g-g-v curve for lateral acceleration. An "aero" car can have a highly non-linear g-g-v plot. If you want to see an F1 car's g-g-v plot, scroll to the bottom of this article for a picture I took of Jeff Willis explaining this at a conference some years ago.

 07-12-2022, 02:21 PM