When you click on links to various merchants on this site and make a purchase, this can result in this site earning a commission. Affiliate programs and affiliations include, but are not limited to, the eBay Partner Network.
I made a few suspension tweaks last season to reduce under steer on my GT4. My butt dyno said they work but thought I'd look at some data. Steering angle info is coming from the ECU to my Solo DL. The data is supposed to be in degrees but I'm getting readings of -801 to +844. Are these really .01 degree? On my measures plot, the range was preset to - 500 to +500, I changed that to 1000 and the graph looks O.K. I'm thinking that overlaying two laps (before and after suspension mods) will give me what I'm looking for?
I made a few suspension tweaks last season to reduce under steer on my GT4. My butt dyno said they work but thought I'd look at some data. Steering angle info is coming from the ECU to my Solo DL. The data is supposed to be in degrees but I'm getting readings of -801 to +844. Are these really .01 degree? On my measures plot, the range was preset to - 500 to +500, I changed that to 1000 and the graph looks O.K. I'm thinking that overlaying two laps (before and after suspension mods) will give me what I'm looking for?
Quick and easy is an xy plot of steering angle versus lat g. Actual number does matter. You will see vertical tails to the graph where lat b stops building and that is understeer.
Bill, you want to look at trends, not just the physical motion on two laps. Matt’s visualization (easy to do) works really well to “see” the amplitude of understeer (or not).
For many drivers, steering (and the perceived amount required, versus the result) is often as difficult to quantify consistently as braking.
I would also look at average steering angle (a new AiM feature) within a predefined sector, validate with a strip chart showing expected versus actual steering angle and, of course, the sector times themselves.
Look at a broad swath of quick laps, before and after, to avoid making decisions based on outliers.
__________________ -Peter Krause www.peterkrause.net www.gofasternow.com
"Combining the Art and Science of Driving Fast!"
Specializing in Professional, Private Driver Performance Evaluation and Optimization
Consultation Available Remotely and at VIRginia International Raceway
Quick and easy is an xy plot of steering angle versus lat g. Actual number does matter. You will see vertical tails to the graph where lat b stops building and that is understeer.
Here's a screenshot from a lap @ WGI. I believe that I'm seeing the "vertical tails" on the right side and looking at the data, this looks like Turn 1 in the worst case. Is there a way to tell my position on the lap?
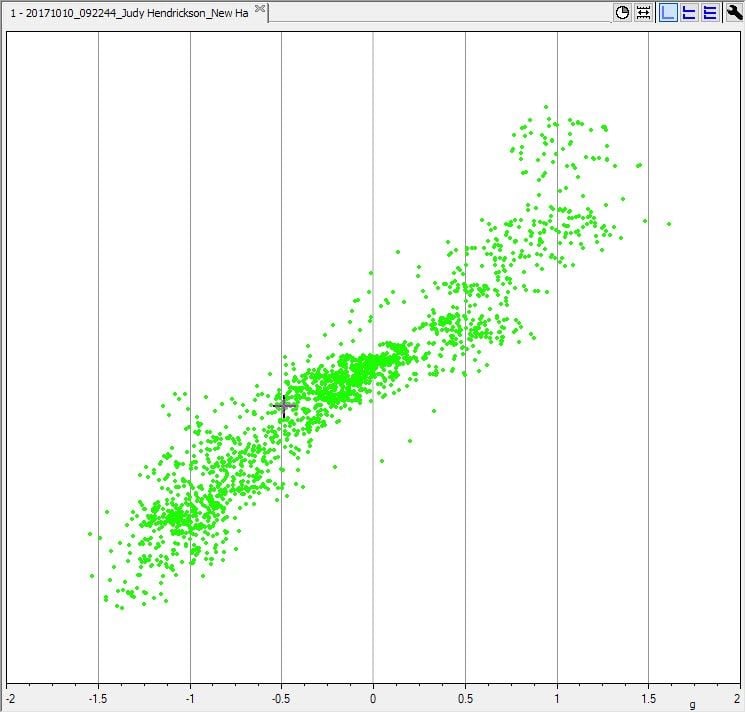
It looks like you might have an extra channel selected. The graph should look something like these. The first is a pretty neutral car and the next is one that has some more understeer. I can look and find a really bad one later if you want to see it.
This is minimal understeer. The top right portion of the graph shows some more than the lower left.
This is minimal understeer
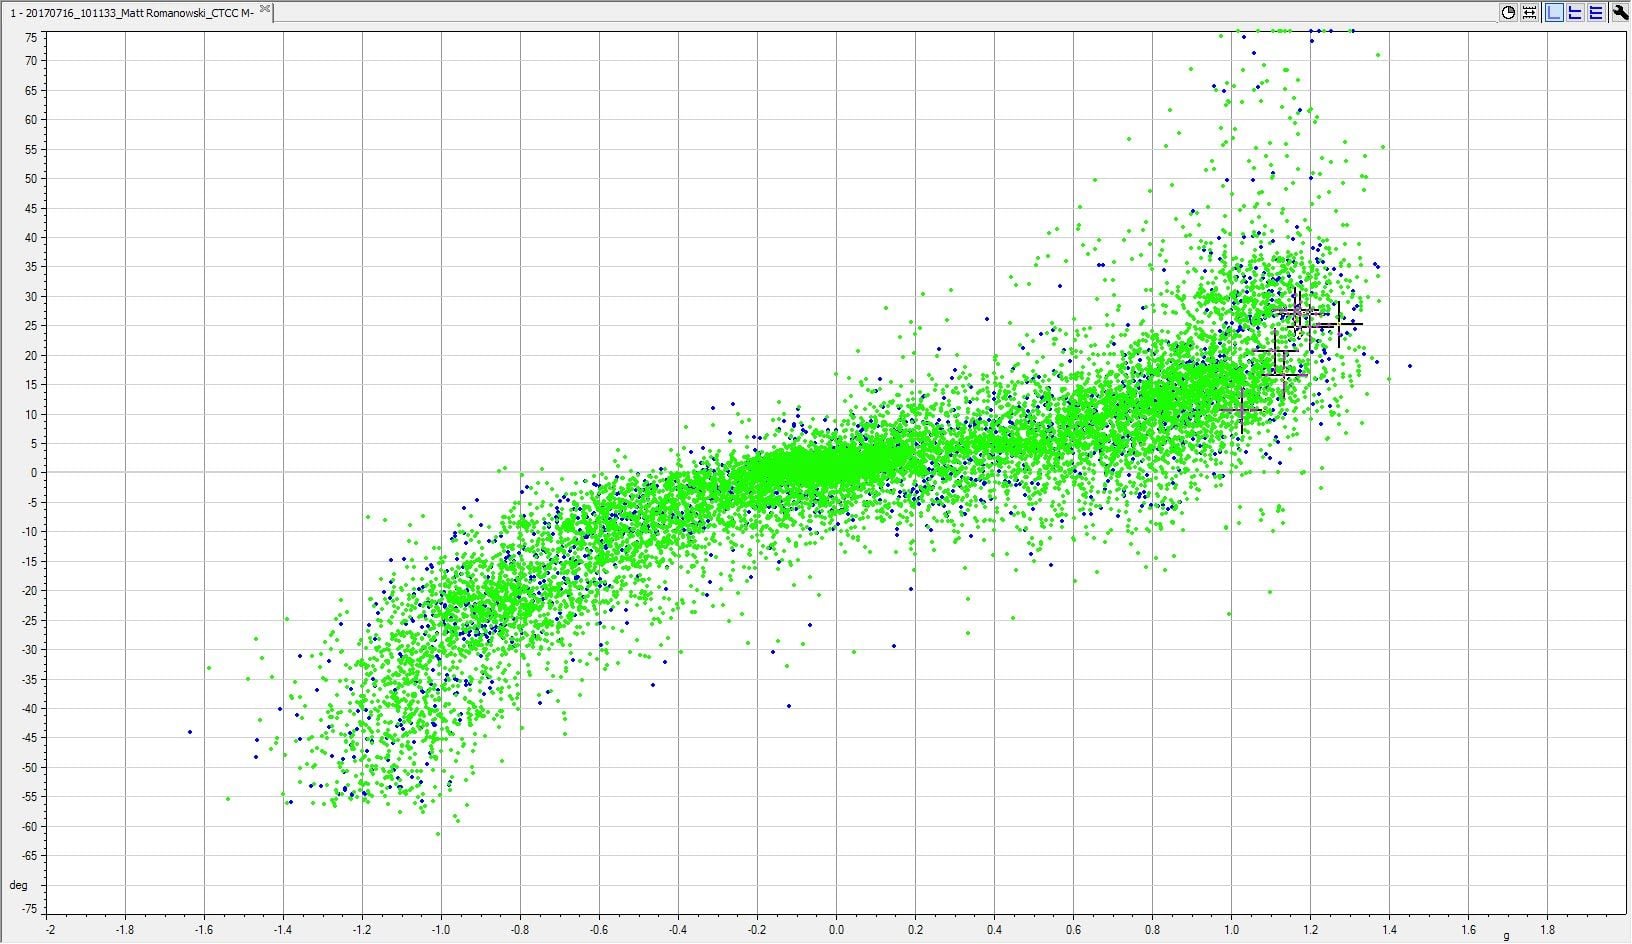
This is a number of laps showing the understeer in the vertical portions of the graph.
 01-21-2018, 02:51 PM