
Technical data on "flashes"
 11-18-2010, 08:11 PM
#61
Intermediate

Join Date: Jun 2010
Posts: 30
Likes: 0
Received 0 Likes
on
0 Posts
2009 tip turbo
Mods:
Modified VTG turbo
tubi exhaust
4.5'' intercooler
custom ECU
( both on pump gas 95 )
normal mode:
I'm not sure but I think this was SPORT mode as the RPM set too hight:
Mods:
Modified VTG turbo
tubi exhaust
4.5'' intercooler
custom ECU
( both on pump gas 95 )
normal mode:
I'm not sure but I think this was SPORT mode as the RPM set too hight:

 11-29-2010, 05:09 AM
#65
Intermediate
Join Date: Jun 2010
Posts: 30
Likes: 0
Received 0 Likes
on
0 Posts
12-01-2010, 03:13 PM
#66
12-06-2010, 01:07 AM
#67
Intermediate
Join Date: Jun 2010
Posts: 30
Likes: 0
Received 0 Likes
on
0 Posts
01-03-2011, 05:44 PM
#68
Intermediate
Join Date: Mar 2010
Location: Surrey UK
Posts: 40
Likes: 0
Received 0 Likes
on
0 Posts
Sorry for the delay but been researching this more in terms of comparison and in fact on another thread the topic of Volumetric Efficiency came up. Having studied this, it seems this is a better way of comparing different setups without taking into account weight, gradient and so.
Volumetric efficiency (in reference to gas engines) is a measure of how well an engine can move air and fuel in and out of the cylinders. It is expressed as a ratio or percentage volume of fuel and air actually admitted into the engine compared to the piston displacement volume. Thinking of an engine as an air pump, the greater power is produced by pumping more air and fuel through the engine/unit time (ie increasing VE).
One of the issues with my car for example is that the actual engine load calculated from durametrics is not accurate because of the FORD MAF.
In most examples, especially from the DME in 997+, the actual engine load is very close to VE, within a few percent. But not with FORD MAF - I could never figure out why my engine load was less than some other less powerful packages.
The formula is very simple.
=2.63 * (MAF)* (IAT+273)/RPM. You can take those figures directly from durametrics and calculate VE.
We have done this with several cars already.
997.1t std is around 185.
A28s with support mods around 255
x50 with stage 1 map/exhaust is around 200-210
clipped vtgs around 220
K24/20g with support mods up at 300.
You can see from the images attached what it shows.
01-04-2011, 05:08 AM
#69
Addict
Lifetime Rennlist
Member
Lifetime Rennlist
Member
996ttalot
This sounds interesting and definitely extrapolating VE or BMEP from the Durametric readings could be very enlightening and great way to compare different engines and how well tuned they are.
I am not very clear from your graph, it shows a VE of 300% at peak torque? That sounds very high.
These figures need to be adjusted to boost levels. There is a very old, and rather contentious, thread somewhere on RL about BMEP and VE. Comparing VE on engines running different boost levels is not indicative of engine performance (or efficiency), the higher the boost level the higher the VE and BMEP, so boost levels have to be adjusted for, in my opinion, if this is what it is been tried to achieve here.
I also am not sure how in your formula MAF reading converts to torque or HP, one needs to know how much fuel is burnt per HP/min as well on these engines first I guess
This sounds interesting
and definitely extrapolating VE or BMEP from the Durametric readings could be very enlightening and great way to compare different engines and how well tuned they are.I am not very clear from your graph, it shows a VE of 300% at peak torque? That sounds very high.
These figures need to be adjusted to boost levels. There is a very old, and rather contentious, thread somewhere on RL about BMEP and VE. Comparing VE on engines running different boost levels is not indicative of engine performance (or efficiency), the higher the boost level the higher the VE and BMEP, so boost levels have to be adjusted for, in my opinion, if this is what it is been tried to achieve here.
I also am not sure how in your formula MAF reading converts to torque or HP, one needs to know how much fuel is burnt per HP/min as well on these engines first I guess
01-04-2011, 01:12 PM
#70
Intermediate
Join Date: Mar 2010
Location: Surrey UK
Posts: 40
Likes: 0
Received 0 Likes
on
0 Posts
Jean,
You are absolutely right - boost levels affect MAF and probably IATs as well. So in a comparison you would need to state boost levels.
Yes 295-305+ on my car is achieved at 1.4bar. The MAF is 2000-2150 at that level. I have the y-pipe solution from Protomotive so there is no restrictions.
In an ideal world, if you were say comparing A28s v 20g, then you would need to have two cars with the same mods and running same boost levels. But at least this gives a better solution than using Actual Engine Load, which on my car is so inaccurate because of the ford MAF.
The other thing we are doing is comparing the results against actual performance on the road as well. My car runs 23.7 secs to 300kph @ 1.3 bar, but will run quicker at 1.5 bar. I just haven't had the right conditions to test that again, but for example when I ran that 23.7 my 0-160 time was 6.9 seconds where as in late November running at 1.5 bar, I hit the same in 6.27 seconds.
It comes back to the theory that MAF does represent engine power in very simple terms, but in this instance takes into account the IATs etc.
Will keep the post updated as more data becomes available. The good thing is that anyone who has datalogs should be able to provide their VE results.
01-09-2011, 11:15 AM
#71
Addict
Lifetime Rennlist
Member
Lifetime Rennlist
Member
I hope this is not too off topic..I will be happy to delete it.
As was mentioned here, measuring the load on the engine is a reliable form of having a dyno with a durametric tool. Provided the MAF readings are accurate. However It is difficult to find a straight forward formula between engine load and Torque produced by the engine.
So I thought of going back to some basics , and I am happy to be corrected on any of this data
- Stock 997TT MAF flows < 1500Kgs/hr ~55 lbs/mn. of airmass.
- These engines have a specific output of ~9.5Hp/lbs of air
=> Max HP on stock MAF ~ bhp (9.5 x 55= 522HP)
If we extrapolate the MAF readings from this thread and convert them to HP using the formula above, then we can calculate the torque values of the engine.
The validation comes through overlapping those torque values on a dyno chart, however the issue is that we know dyno charts are inaccurate, so it is a bit irrelevant unless it is a 100% stock engine.
Another way to validate the torque numbers is using BMEP, which is a function of maximum torque and boost, and comparing the calculated BMEP to that of a stock 997TT which is 174..
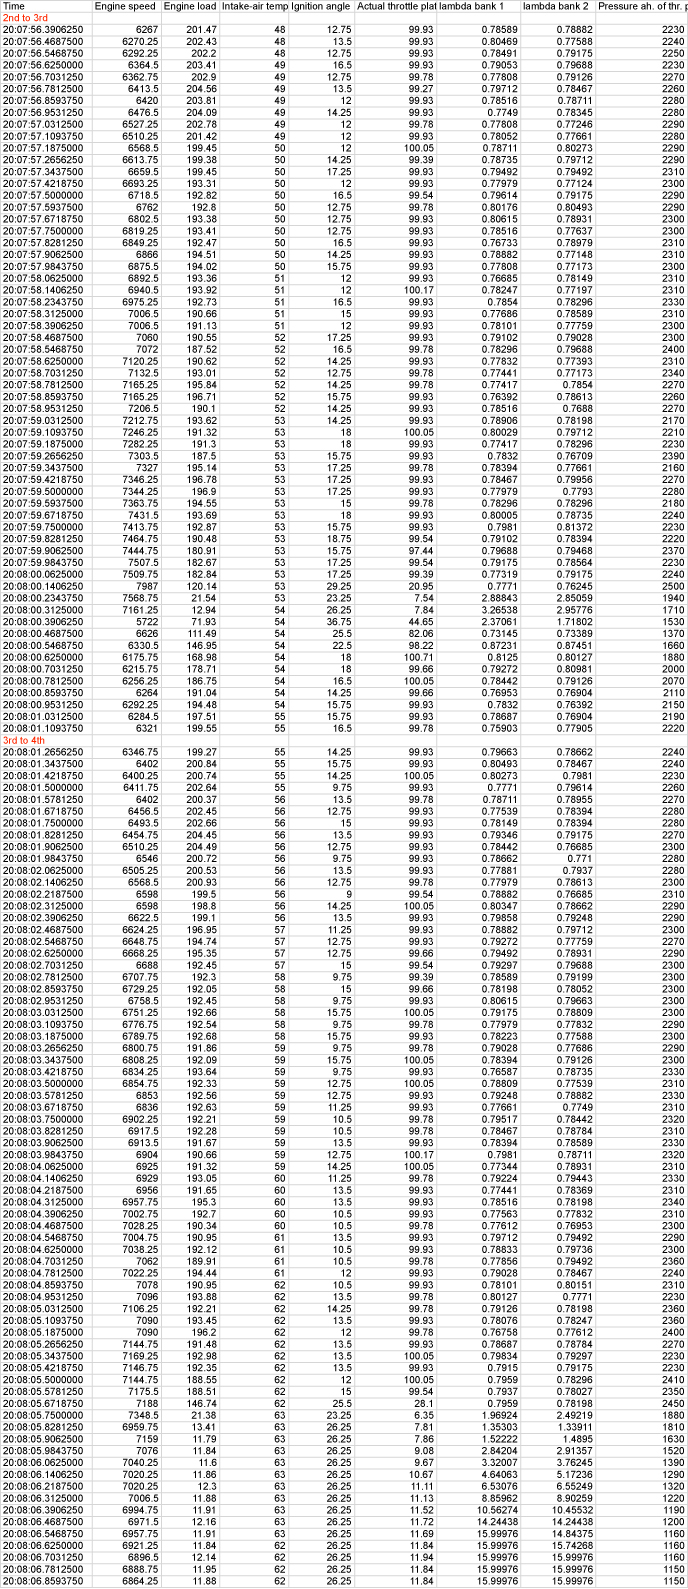
Let's take an example from some data available here.. I am choosing Kevin's run that was posted given its completeness.
From Row 12 of his spreadsheet (maximum load number):
RPM:5063
MAF: 1643 Kg/hr = 60.4 Lbs/Mn.
Boost: 2215 = 1.26Bar
Calculated HP: 60.4 x 9.5 = 574HP
Calculated Torque: 595 lbs.ft
Extrapolating to BMEP:
BMEP= (150.8 x (595/220))/1+1.26 = 180 (stock 174)
Numbers for calculated torque seem very reasonable, I am assuming this engine has modifications done to it that have improved its efficiency by around 3% or more.
There is a margin of error with this approach, such as specific output could be anywhere between 9.5 to 10 therefore the limits of MAF can reach 550HP instead of 522HP mentioned above. MAF could be nearer to 1450Kgs/hr instead of 1500Kgs/hr, etc..
Stock Injectors are limited to around 560HP-600HP @ 85%-90% duty cycle.
If someone has a 100% stock 997TT or GT2 and can log runs with all these readings through a wide range of RPMs we could validate all of this easily.
As was mentioned here, measuring the load on the engine is a reliable form of having a dyno with a durametric tool. Provided the MAF readings are accurate. However It is difficult to find a straight forward formula between engine load and Torque produced by the engine.
So I thought of going back to some basics , and I am happy to be corrected on any of this data
- Stock 997TT MAF flows < 1500Kgs/hr ~55 lbs/mn. of airmass.
- These engines have a specific output of ~9.5Hp/lbs of air
=> Max HP on stock MAF ~ bhp (9.5 x 55= 522HP)
If we extrapolate the MAF readings from this thread and convert them to HP using the formula above, then we can calculate the torque values of the engine.
The validation comes through overlapping those torque values on a dyno chart, however the issue is that we know dyno charts are inaccurate, so it is a bit irrelevant unless it is a 100% stock engine.
Another way to validate the torque numbers is using BMEP, which is a function of maximum torque and boost, and comparing the calculated BMEP to that of a stock 997TT which is 174..
Let's take an example from some data available here.. I am choosing Kevin's run that was posted given its completeness.
From Row 12 of his spreadsheet (maximum load number):
RPM:5063
MAF: 1643 Kg/hr = 60.4 Lbs/Mn.
Boost: 2215 = 1.26Bar
Calculated HP: 60.4 x 9.5 = 574HP
Calculated Torque: 595 lbs.ft
Extrapolating to BMEP:
BMEP= (150.8 x (595/220))/1+1.26 = 180 (stock 174)
Numbers for calculated torque seem very reasonable, I am assuming this engine has modifications done to it that have improved its efficiency by around 3% or more.
There is a margin of error with this approach, such as specific output could be anywhere between 9.5 to 10 therefore the limits of MAF can reach 550HP instead of 522HP mentioned above. MAF could be nearer to 1450Kgs/hr instead of 1500Kgs/hr, etc..
Stock Injectors are limited to around 560HP-600HP @ 85%-90% duty cycle.
If someone has a 100% stock 997TT or GT2 and can log runs with all these readings through a wide range of RPMs we could validate all of this easily.
01-09-2011, 12:53 PM
#72
Intermediate
Join Date: Mar 2010
Location: Surrey UK
Posts: 40
Likes: 0
Received 0 Likes
on
0 Posts
Jean,
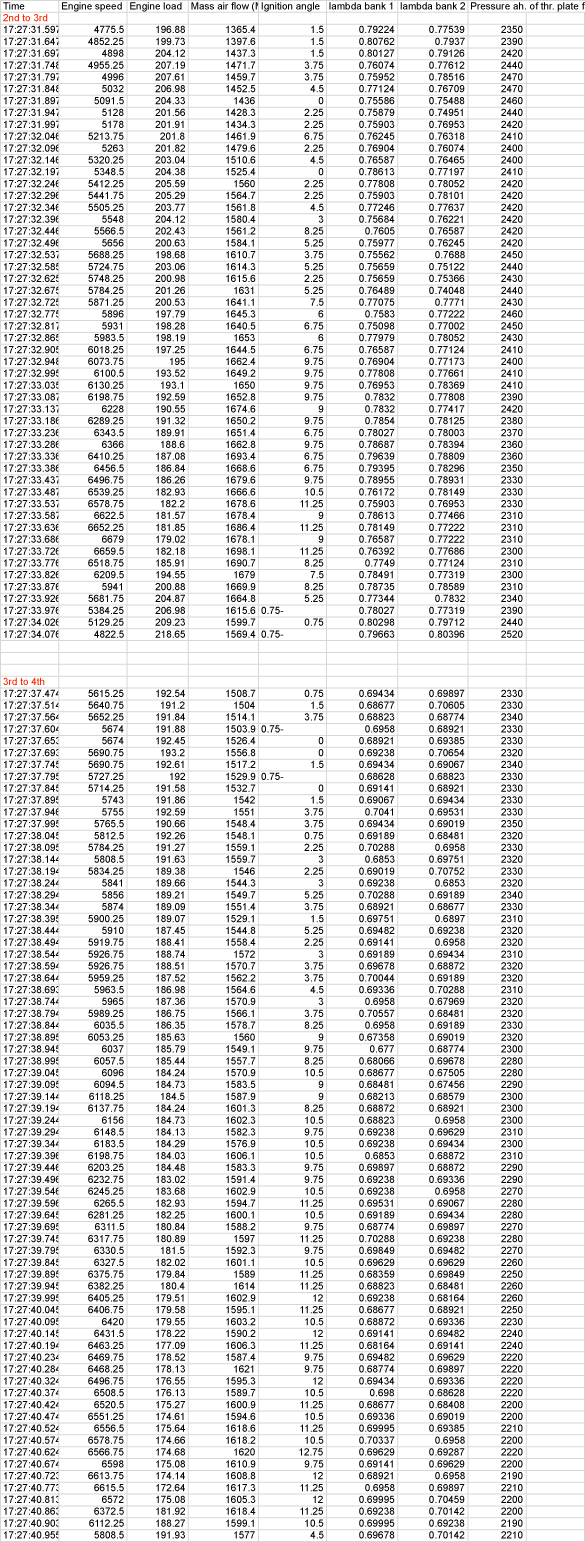
See the attached files. So I have included from testing run late November both the durametrics and vbox data. Two passengers, 3/4 tank of fuel.
You have to ignore the engine load on my car because of the Ford MAF.
I done a couple of 0-160kph runs that day with best of 6.27 for which I have the vbox as well, but since it was at vmax it was not possible to get 0-300kph run that day.
I also had 0-138.9mph in 10.82 secs 1/4 mile on the day as well ( just me in the car)
Quite funny that day because on that run below from the bottom of the bend I had a 6.68 60-130mph which was on a 1.38% incline (not the normal decline as others measures) - Brunters is quite surprising because you can see that basically for a 300kph run, it is on a gradual incline nearly all the way.
Ken
01-09-2011, 02:56 PM
#73
Addict
Lifetime Rennlist
Member
Lifetime Rennlist
Member
Ken
Those are very fast times. According to your logs you are running at 1.5-1.6Bar, I can see IATs climbing yet staying within reasonable limits but your timing must be being pulled back. Does the tool allow you to post EGTs and timing for this same run?
The readings on your MAF seem inaccurate, basis these load numbers and RPMs, I calculated your maximum torque to be 680lbs.ft, which would put your BMEP at 190, too high for these cars at this tune level (no head porting, static compression changes or major breathing modifications). You have upgraded your injectors too I assume.
01-09-2011, 03:35 PM
#74
Intermediate
Join Date: Mar 2010
Location: Surrey UK
Posts: 40
Likes: 0
Received 0 Likes
on
0 Posts
Ken
Those are very fast times. According to your logs you are running at 1.5-1.6Bar, I can see IATs climbing yet staying within reasonable limits but your timing must be being pulled back. Does the tool allow you to post EGTs and timing for this same run?
The readings on your MAF seem inaccurate, basis these load numbers and RPMs, I calculated your maximum torque to be 680lbs.ft, which would put your BMEP at 190, too high for these cars at this tune level (no head porting, static compression changes or major breathing modifications). You have upgraded your injectors too I assume.
Those are very fast times. According to your logs you are running at 1.5-1.6Bar, I can see IATs climbing yet staying within reasonable limits but your timing must be being pulled back. Does the tool allow you to post EGTs and timing for this same run?
The readings on your MAF seem inaccurate, basis these load numbers and RPMs, I calculated your maximum torque to be 680lbs.ft, which would put your BMEP at 190, too high for these cars at this tune level (no head porting, static compression changes or major breathing modifications). You have upgraded your injectors too I assume.
The tune still needs modification because we are leaving power on the table and I still need to work out the 0.76 issue at certain points with Todd.
I didn't record EGT or timing for the same run but I have other runs for ignition angle etc.
I will do some testing with Toby once he gets his car back and post those up as well.
Here is a list of the modifications
996tt upgraded to full Protomotive car
- K24/20g turbos
- 60lb injectors with 3.8fpr
- twin fuel pumps to support hp
- 5 inch intercoolers
- full blown thru system with intakes directly above the intercoolers (no rear airbox)
- upgrade tiptronic gearbox to 1300nm, upgraded TCU/TC.
- Porsche Motorsports performance friction brake upgrade (6 pots)
- Miltek 100 cell exhaust with headers ported and polished
- EBC allowing control from 550-680AWHP
Ken
p.s. fueling was at 82% at 200mph.
Here is another datalog. I had wrong boost parameter but I know from the EBC that max boost on that run was 1.35 bar.
02-05-2011, 09:03 AM
#75
Addict
Lifetime Rennlist
Member
Lifetime Rennlist
Member
I am posting below some Durametric data from my stock 997GT2.
This data has been trimmed given its length and I tried to capture a log where I was able to go full boost, the grip is horrible here (Riyadh, Saudi Arabia currently) and the roads very uneven. The run was for about a 50 mile distance at speeds above 130mph mostly, with several peaks at 150mph, 6th gear all the way.
Ambient temperature was 17-19 degrees C. Elevation is 630meters...barometric pressure is 950 HKPa.
I have done manual calculations of torque and HP, the peak torque numbers seem higher than stock (546 lbs.ft @ 4377 RPMs), this is the case in general in 6th gear from the many datalogs I have seen from turbos. Seems that factory dyno numbers could be more accurately achieved in 4th or 5th gear. The HP curve seems pretty much in sync with the factory dyno. Interesting to look at Timing and AFR data.
I will soon be trying a "flash" from a known US tuner and will do back to back testing.
Last edited by Jean; 02-05-2011 at 09:19 AM.