When you click on links to various merchants on this site and make a purchase, this can result in this site earning a commission. Affiliate programs and affiliations include, but are not limited to, the eBay Partner Network.
Was curious about something and decided to put in the time to research.
These are cars I've pulled from the last 4-6 months ago - it's not exhaustive at all, but primarily from Car Gurus, rennlist, pelican and autotrader.
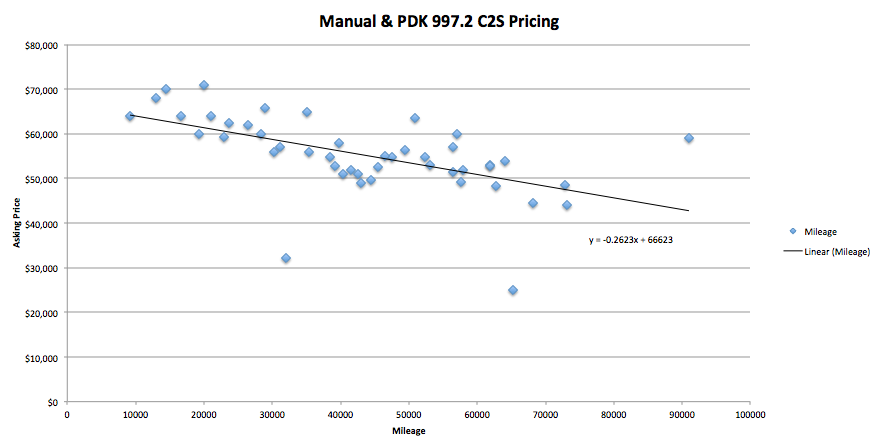
The pricing only applies to 997.2 C2Ss - inclusive of both manual and PDK. Manual data suggests lower pricing actually (also about 37% of the subset - 47 cars)
The pricing equation works rather nicely - when my car had 74k miles on it last year (09 C2S 6SP), I had a written offer for $48k private party. The equation showed $47,212.
I have C4S data too but didn't feel like compiling it if anyone else wants to do it.
So looks like about a $2700 drop for each additional 10000 miles on the clock. Not taking into account year, condition or options but a nice chart. Thanks
How about a 3-D plot with price, mileage and year? To some extent mileage is correlated with year, but there are some garage queens with low mileage for their age.
My 2009 C2S PDK with about 36k miles comes up at about $57k using the equation. Not sure I could get that much for it.
Thanks for for posting this, great data! What is the range of sales dates?
If you really wanted accurate info, wouldn't you have to find out/determine what the cars actually sold for - Not base stats on asking prices??
There are so many variables and dealers over inflate prices/etc.
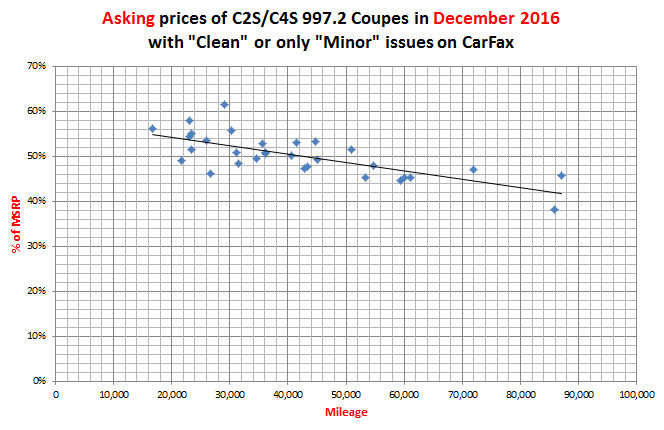
FWIW I did something similar back in late 2016. Here's the asking price vs. mileage, both in absolute and as a % of MSRP, that I saw back then. I only included cars with CarFax info available...
I didn�t take this too seriously and lumped all 09 -11s together.
yes I agree that selling prices matter more, but there was more data available in asking prices.
You�d think manual cars would trend higher, but that was not the case - suggesting a number of things, but largely that there likely aren�t enough data points available.
"You’d think manual cars would trend higher, but that was not the case - suggesting a number of things, but largely that there likely aren’t enough data points available"
Me thinks not many millenials know or bother to learn a manual gearbox. These are the 3rd and 4rth owners or buyers of higher mileage 997's.
if you could update this to a box and whisker chart with listing date on the independent axis with price as some function of deviation from a best fit line on the dependent I'd appreciate it. Really need the price whinging to the next level.
I didn’t take this too seriously and lumped all 09 -11s together.
yes I agree that selling prices matter more, but there was more data available in asking prices.
You’d think manual cars would trend higher, but that was not the case - suggesting a number of things, but largely that there likely aren’t enough data points available.
I've noticed asking prices on many Tipronic cars, in many for-sale venues(CL/EBAY/Dealers/Cars,com/etc) listed way higher and selling at a much lower $% than manuals.
IMHO, Tiptronic owners don't quite realize the lower value and ask higher asking prices.
Anyone else agree?
if you could update this to a box and whisker chart with listing date on the independent axis with price as some function of deviation from a best fit line on the dependent I'd appreciate it. Really need the price whinging to the next level.
if you could update this to a box and whisker chart with listing date on the independent axis with price as some function of deviation from a best fit line on the dependent I'd appreciate it. Really need the price whinging to the next level.
In addition, we'll need to see the Pearson correlation coefficient for the line as well as best fit calculations for non-linear curves.
Awesome stuff! Thanks for sharing this. It's also interesting to compare to the 2016 data, which matches better with my purely anecdotal/'gut feel' for prices then and now, especially the $50K/50Kmiles crossover point that I have convinced myself of. I do love that the OP's written offer/valuation is way better than my gut feel, especially as a fellow 09 C2S manual owner (w/ 50k on the clock). Totally agree with the acknowledgments that the sample sizes are still too small to make statistically significant conclusions, but still fun.
Eyeballing the OP's data vs, 2016 and making totally unfounded assumption that they are comparable data sets, the slope is more severe with OP's but there is decent data match at the lower $/higher mileage end of the plots. If I ask 'why is the slope more severe' for OP's data, that pocket of > $60K cars under 30K miles might be the culprit (overly aggressive asking prices?); it's essentially pulling up the left side of the curve fit. Now if folks are getting those asks (?), then there's signal here vs. 2016 that a nice upward $ shift (over time) is there for < 60Kmile cars, but higher mileage looks flat.
Eyeballing the OP's data vs, 2016 and making totally unfounded assumption that they are comparable data sets, the slope is more severe with OP's but there is decent data match at the lower $/higher mileage end of the plots. If I ask 'why is the slope more severe' for OP's data, that pocket of > $60K cars under 30K miles might be the culprit (overly aggressive asking prices?); it's essentially pulling up the left side of the curve fit. Now if folks are getting those asks (?), then there's signal here vs. 2016 that a nice upward $ shift (over time) is there for < 60Kmile cars, but higher mileage looks flat.
This also implies that both the 2016 and 2018 plots should not be linear. We should be looking at an inverse yield curve with an increasing slope when time is applied as a variable..
Originally Posted by gasongasoff
In addition, we'll need to see the Pearson correlation coefficient for the line as well as best fit calculations for non-linear curves.
are we assuming this is nonlinear regression? I'd think so. I'd also like some standard financial market index coefficient applied.
At the moment pricing is about right. I got a great deal when I picked up my nicely optioned 09 MT C2S with 7500 miles last June for 54k. Realistically it was and probably still is worth 60ish with 11k miles that's on it right now. As time passes though I believe the price gap will widen between PDK and MT, especially on nicer examples.

 03-05-2019, 06:50 PM