
991 tire torque
 02-12-2018, 09:34 PM
#31

Final Graph for completeness.
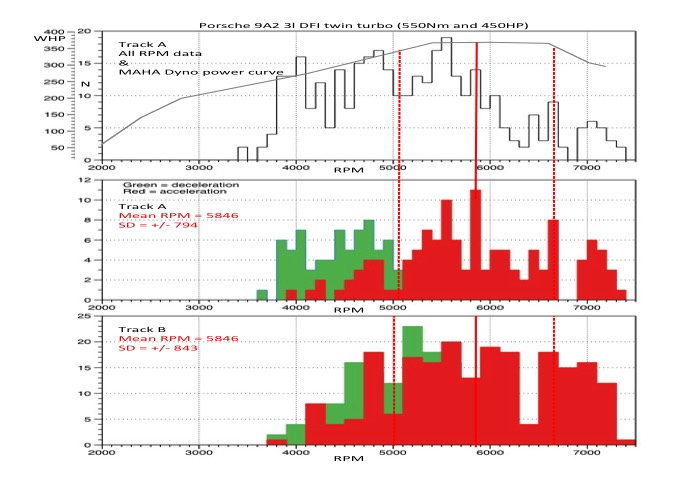
Two different tracks, two months apart (last event of last season and first event of this season)
I'm always amazed how well Porsche systems work and how they manage to deliver optimal performance
I suppose its covered off in the price tag ...
Red bars represent acceleration phases and green bars represent deceleration phases. Note red bars position relative to rear wheel horsepower.
 05-08-2018, 01:45 AM
#32
Rennlist Member
Final Graph for completeness.
Two different tracks, two months apart (last event of last season and first event of this season)
I'm always amazed how well Porsche systems work and how they manage to deliver optimal performance
I suppose its covered off in the price tag ...
Red bars represent acceleration phases and green bars represent deceleration phases. Note red bars position relative to rear wheel horsepower.