When you click on links to various merchants on this site and make a purchase, this can result in this site earning a commission. Affiliate programs and affiliations include, but are not limited to, the eBay Partner Network.
Some of you may have seen my initial 964 Price Analysis (https://rennlist.com/forums/964-foru...-analysis.html). I have updated the analysis with respect to feedback received the first time around. he Rennlist 964 Price Sticky (https://rennlist.com/forums/964-foru...64-prices.html), 2015 Fleabay sales prices as documented in the 964 Price sticky, and prices from BAT. The data set includes 408 records starting in 1991 and going through 2018. It includes sales data including price, mileage, model year, body type, C2/C4, Manual/Tip, and data source. I excluded outliers such as speedsters, RS America, etc. as I felt these cars unfairly skewed the prices paid. (Unfortunately Ralph 3's data might still be off. Long story but basically by the time I realized I had forgotten to update his info I was too far into the update to go back and find it.)
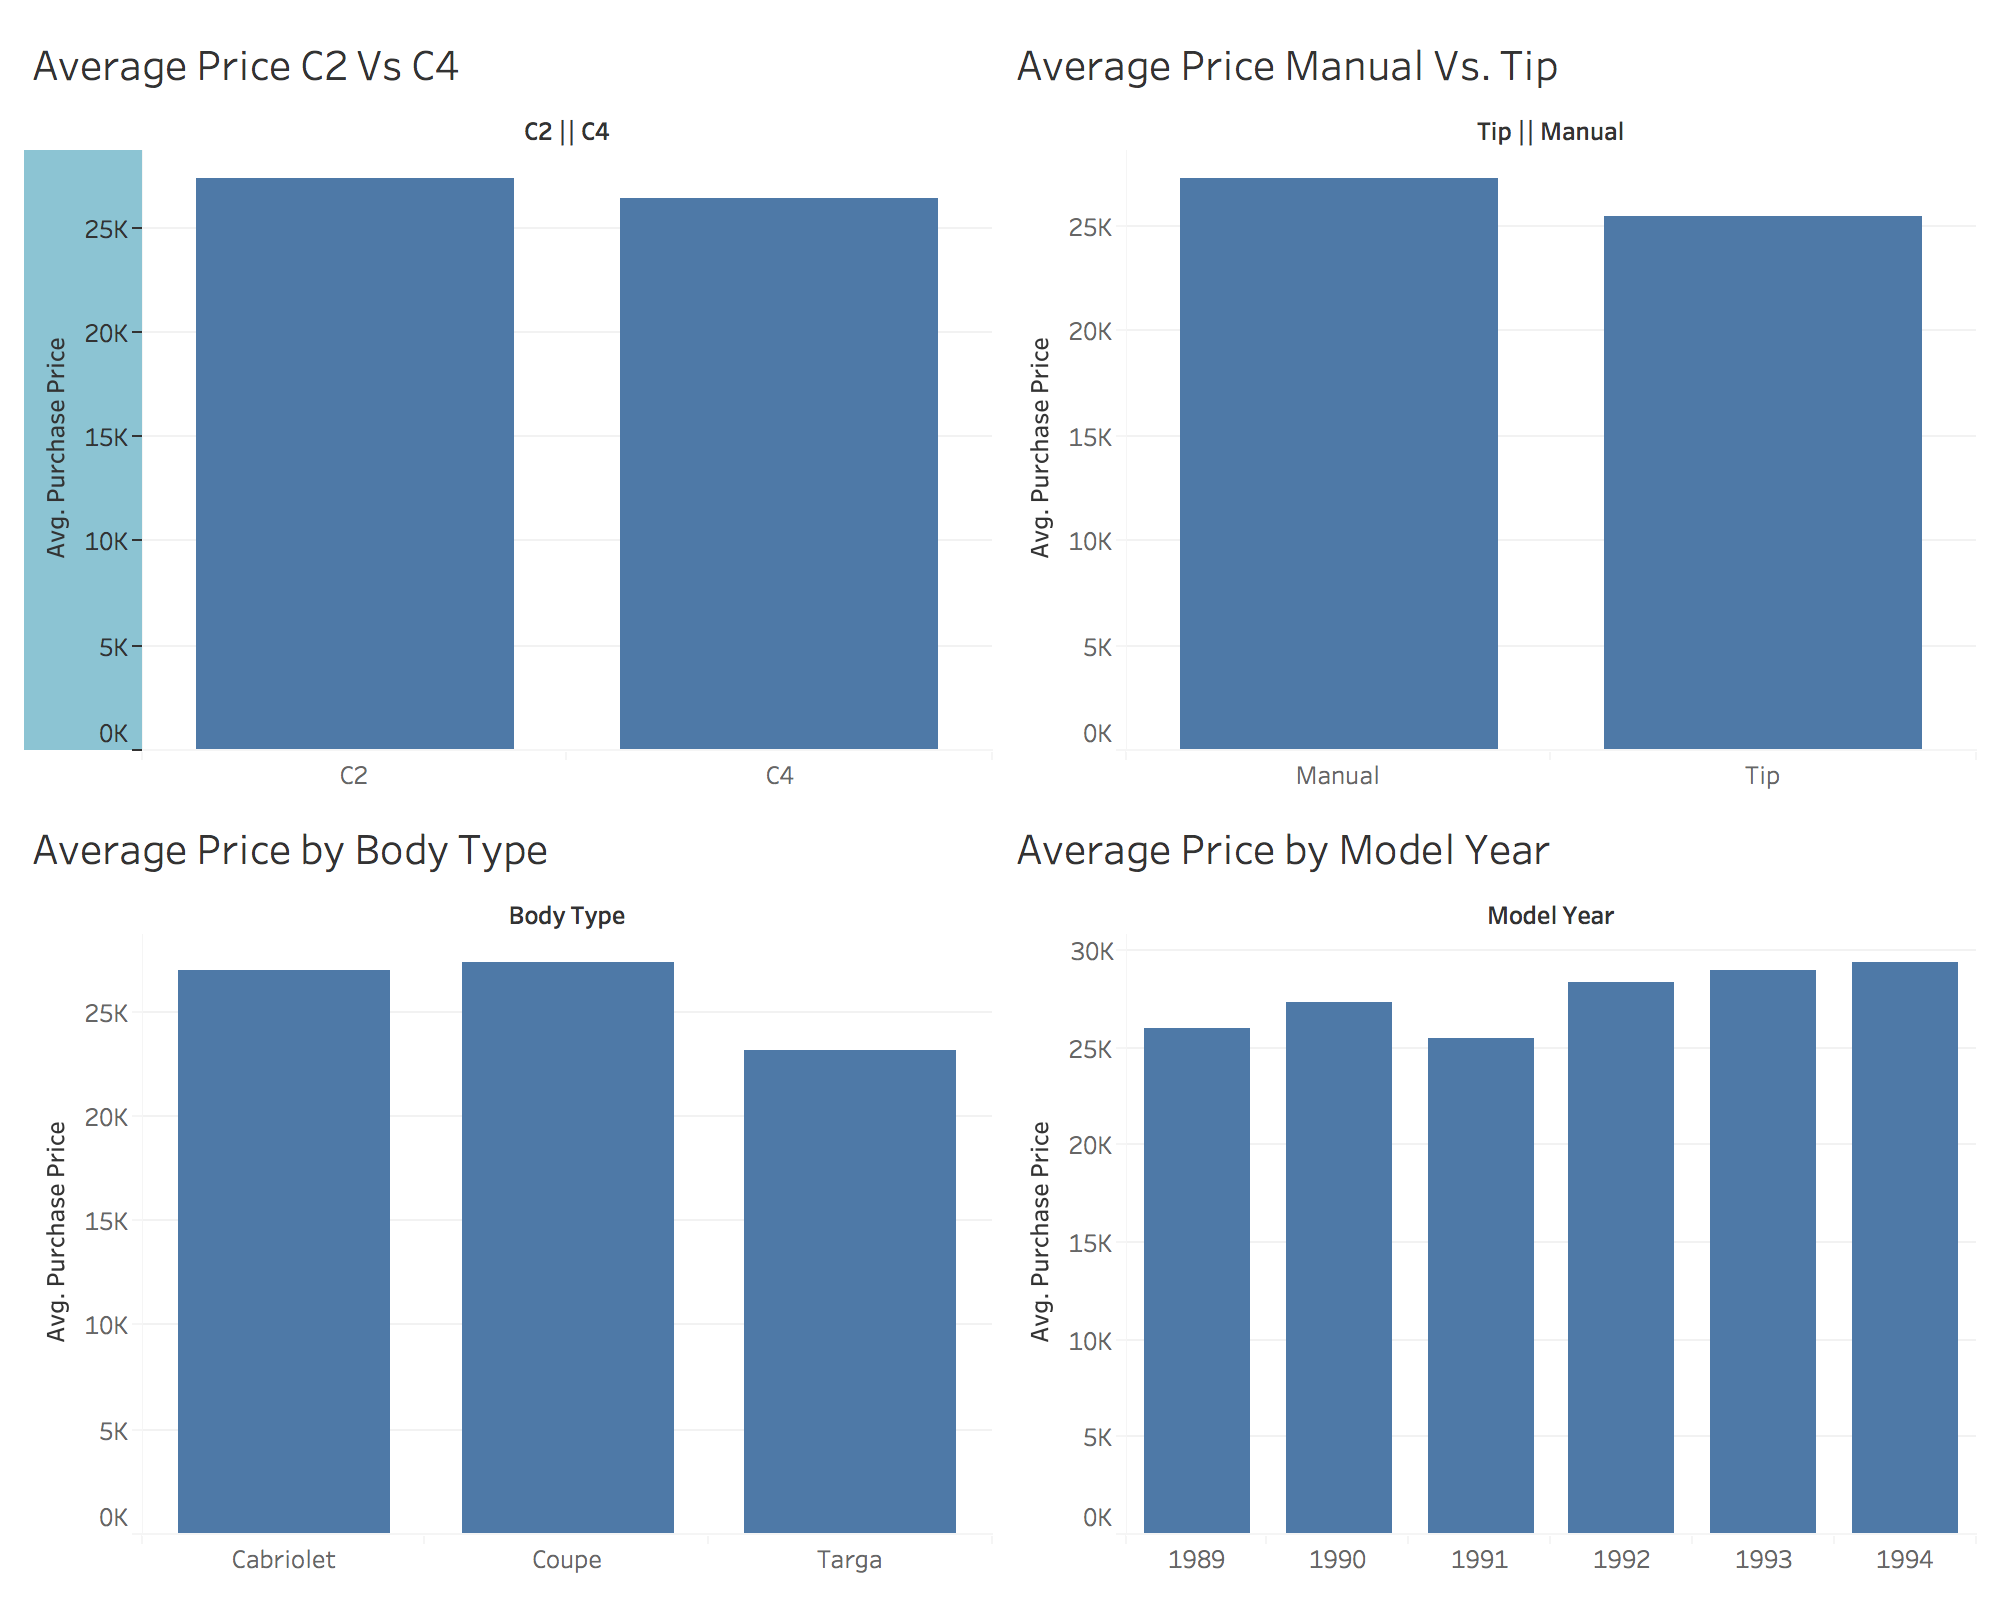
The average purchase price of a C2 was $27,335 while the average price of a C4 was $26,444 (96.7%). The average price of a manual was $27,228 while the average price of a tiptronic was $25,418 (93.4%). The average price of a coupe was $27,318 while a cabriolet was $27,007(98.2%) and a targa was 23,115(85%). 1992, 1993, and 1994 evidenced higher average prices than 1989, 1990, and 1991.
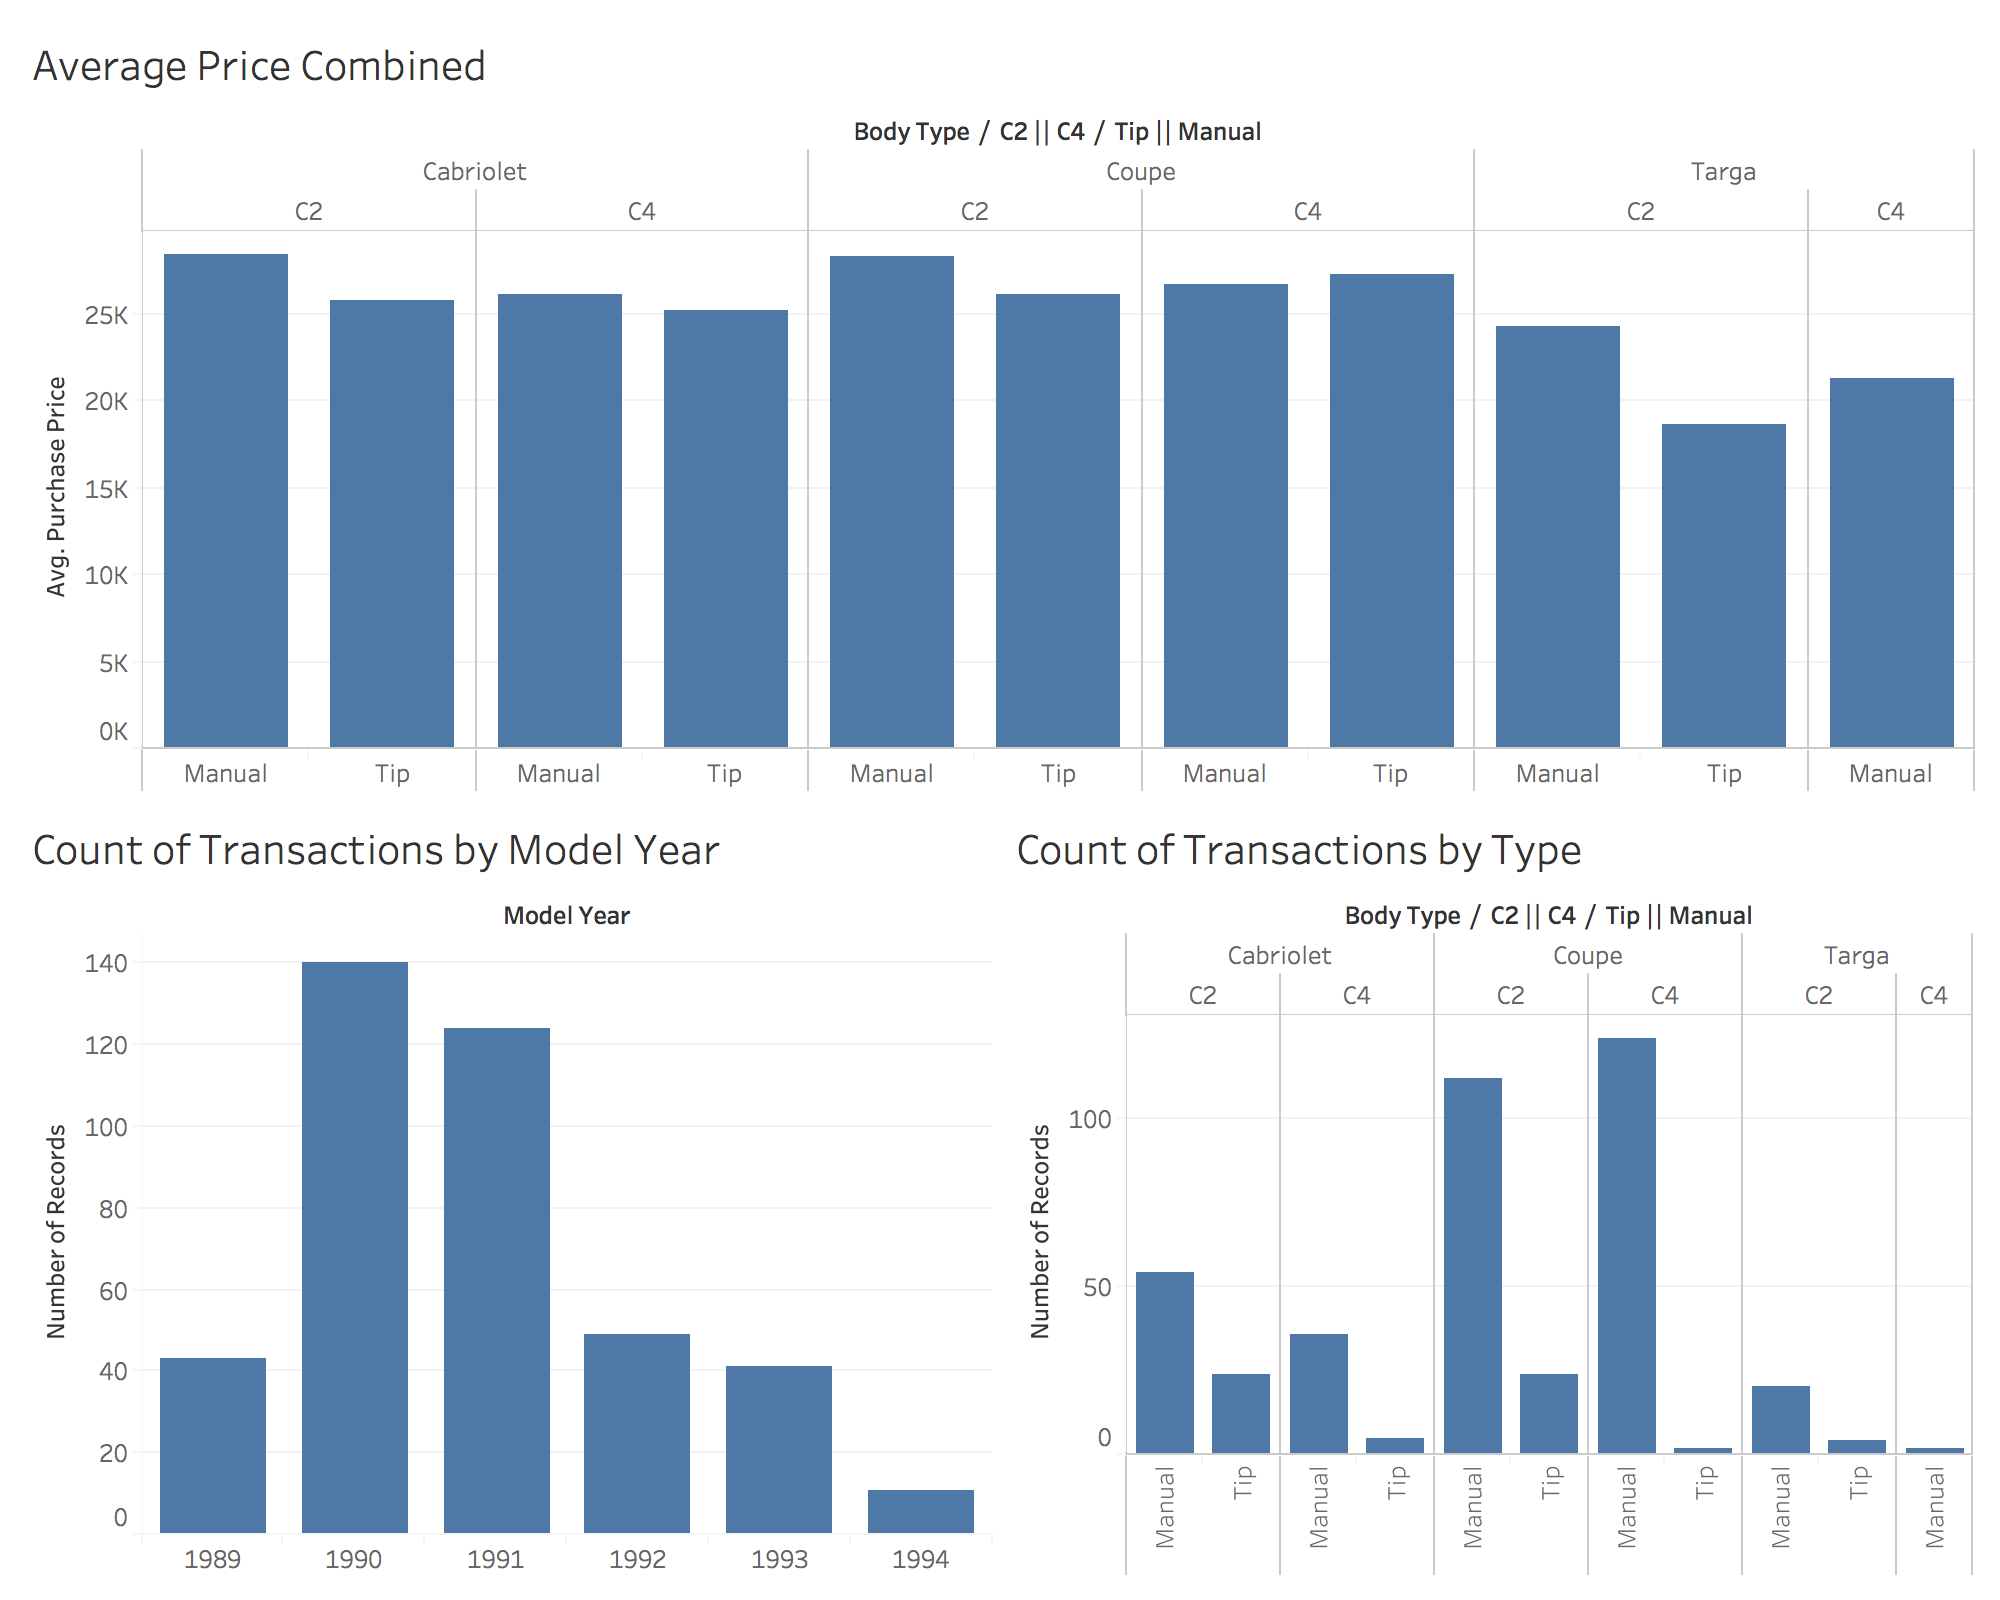
Below I have combined all of the information above into one graph so that the average price of a C2 Manual Carrera can be compared against a C4 Tiptronic Carrera and a C4 Manual Cabriolet and so on. In addition, I have shown the count of transactions in this data set. The data set overwhelmingly consisted of 1990 and 1991 C2 and C4 Manual Coupes. Trends
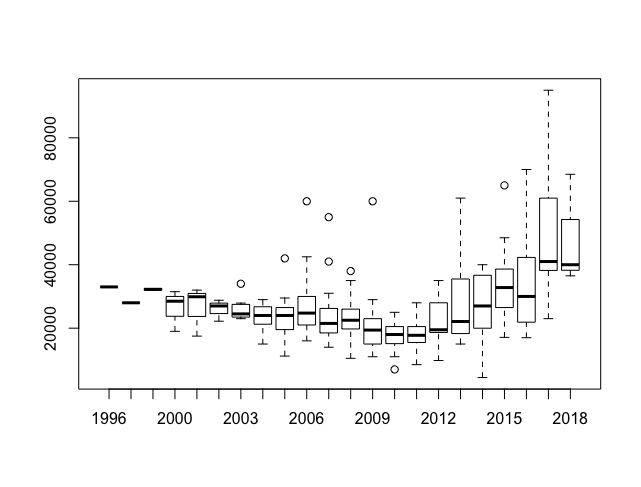
One of the big critiques of my last data set was that it didn't do enough to show recent trends in prices (particularly since 2015). Below is a box chart of prices for each year showing the average price, price quartiles, and potential price outliers. It also shows that 2017 was clearly the best year to sell a Porsche to date.
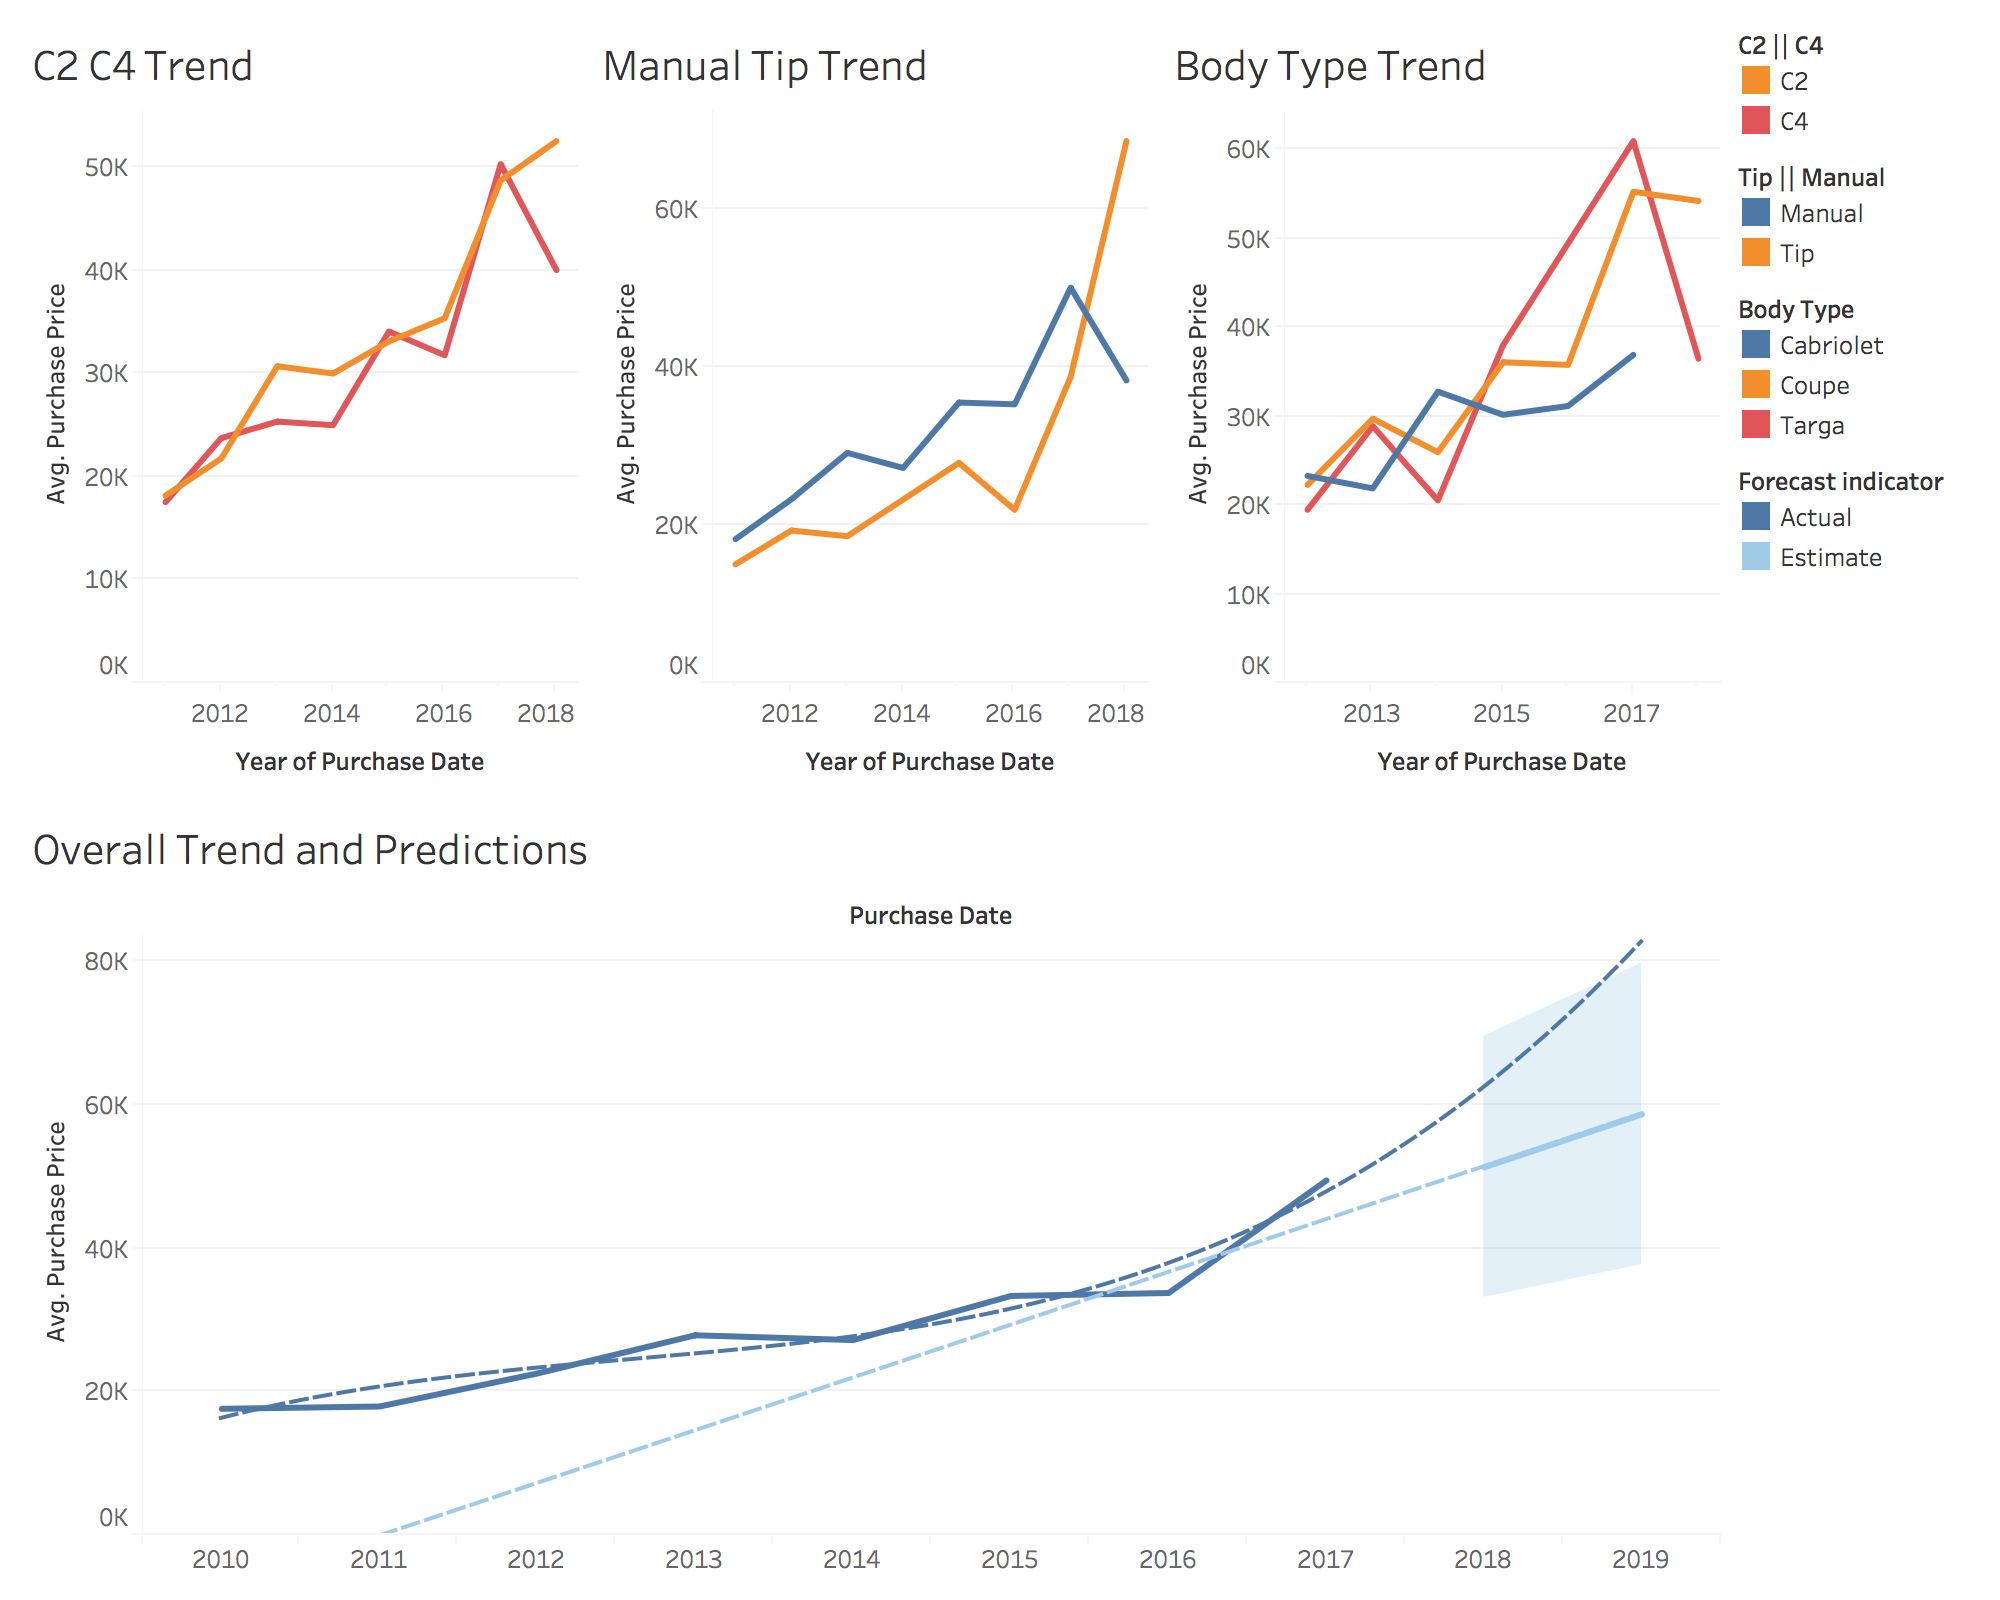
The chart below shows the general trends by body type, transmission type, and drivetrain type. In addition, it presents an average and log trend line:
Predictions:
I first chose to do regression of price against mileage. The resulting formula: Price = 36,052 -.12M +- E where M equals mileage and E is the error term. The model statistics indicate that mileage is responsible for approximately 12% of the value of the car.
Next I chose to perform a multiple regression of price against Purchase.Date, Mileage, Model.Year, C2.C4, Body.Type, and Tip.Manual. The summary results indicate the following:
Due to the programming of the model above it is not very good for predicting the price of the car due to Purchase Date being used as a discrete variable versus a time series. In other words, the model should be fairly accurate to predict prices of sales that actually occurred versus prices that will occur. The *** symbol indicates those variables the model considers significant. The model indicates that the intercept, the car being sold in 2017 or 2018, the mileage, and having a Coupe are all highly significant to price while having a tip is slightly significant. Both increasing mileage and tiptronic negatively impact the price.
I have a C2 Tiptronic Cabriolet with 39,000 miles which it was purchased in 2012. Based upon the model above, my predicted price in 2012 is as follows:
33,224(Intercept) - 2789 (Year bought) - 5070 (Mileage) + 2575 (Model Year) - 3027 (Tiptronic) = $24,913 in 2012. C2 and Cabriolet do not impact my price as they are already included in the intercept.
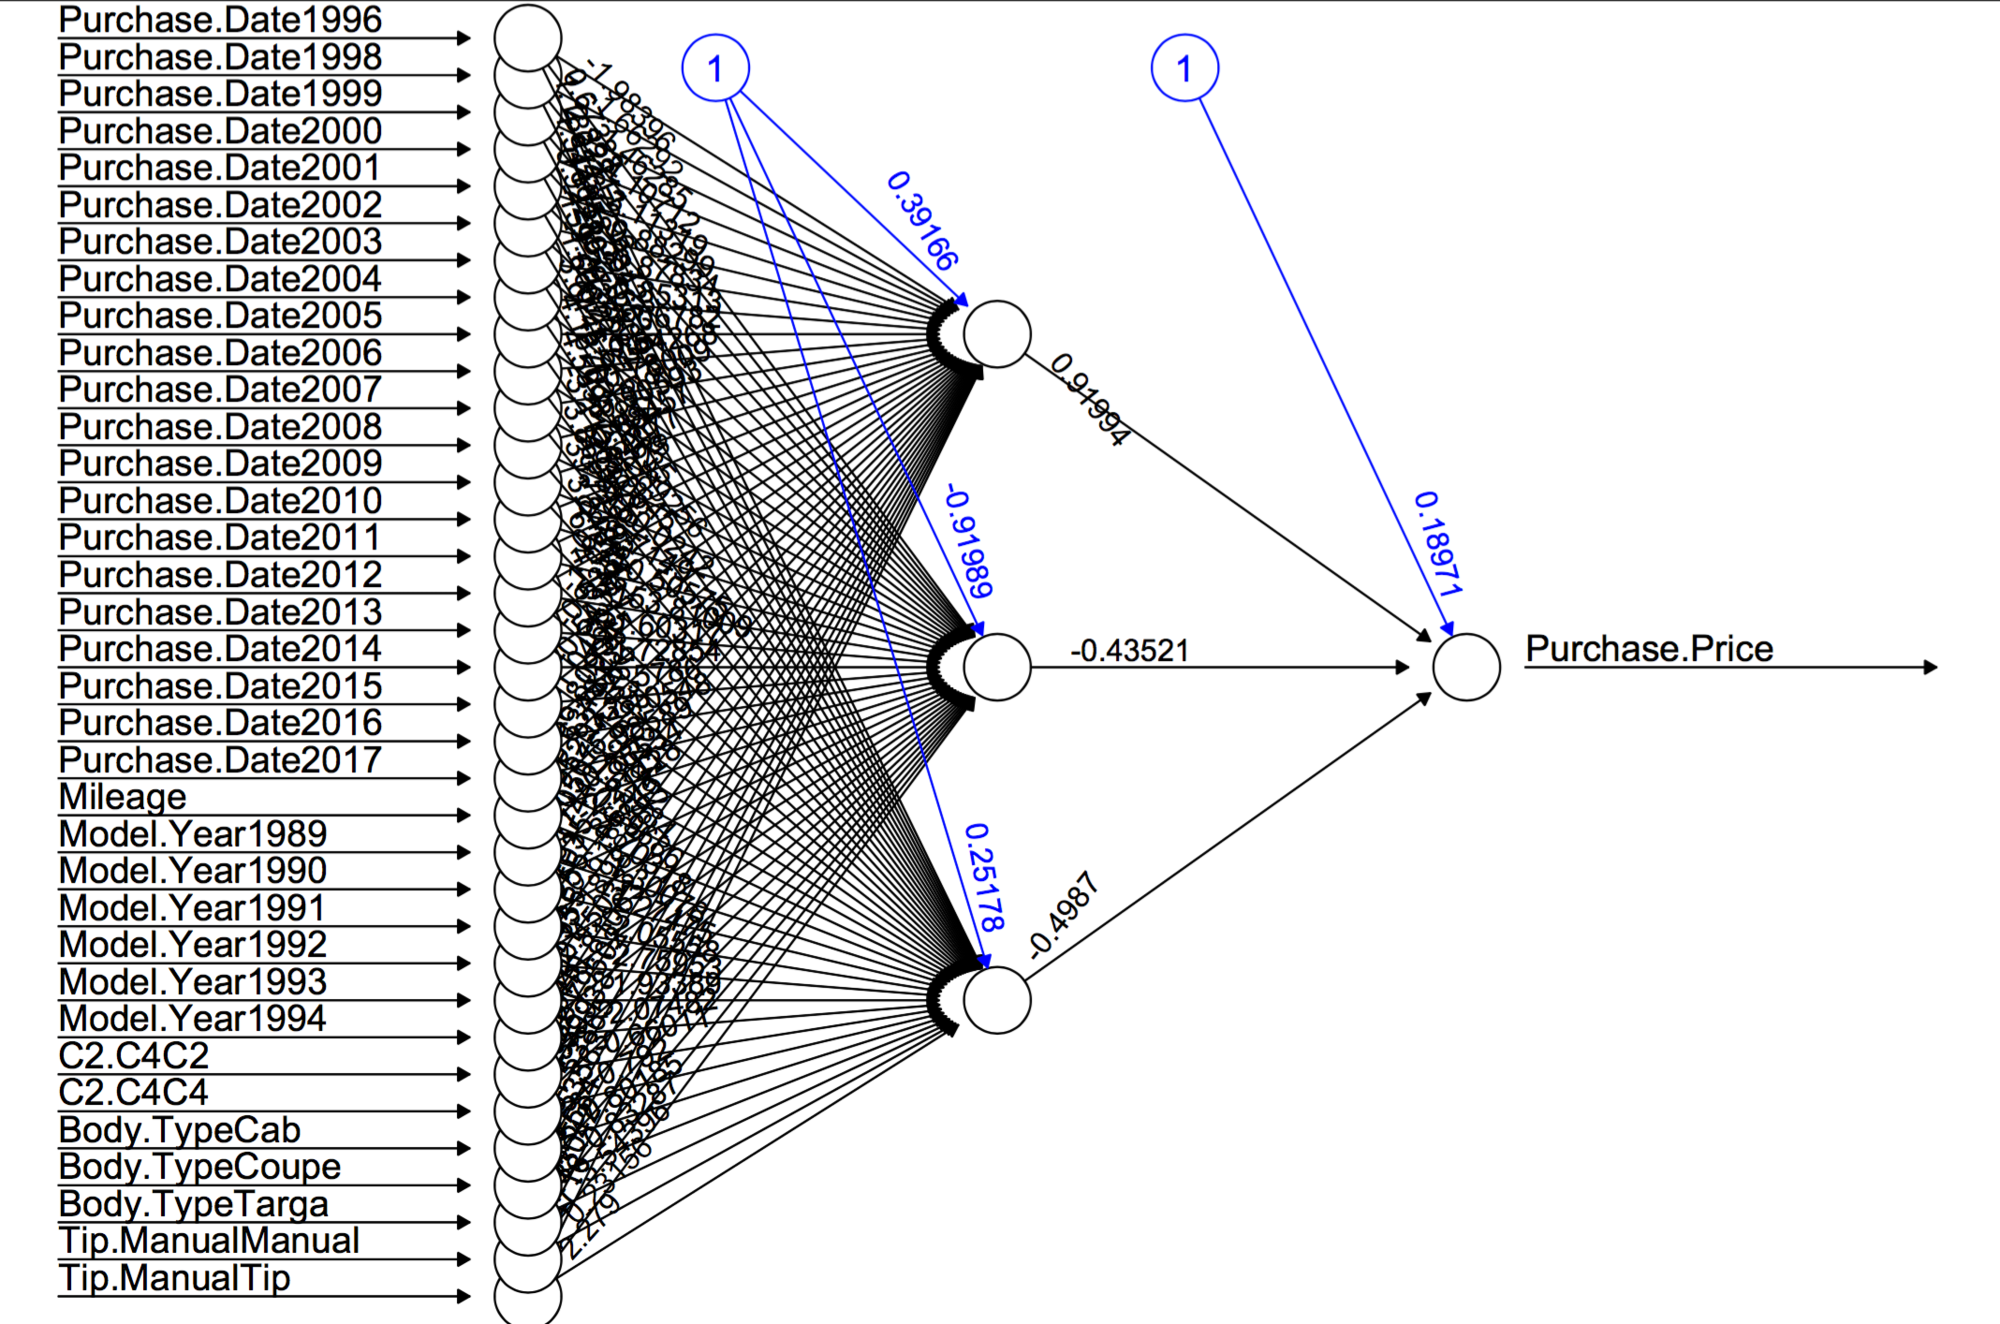
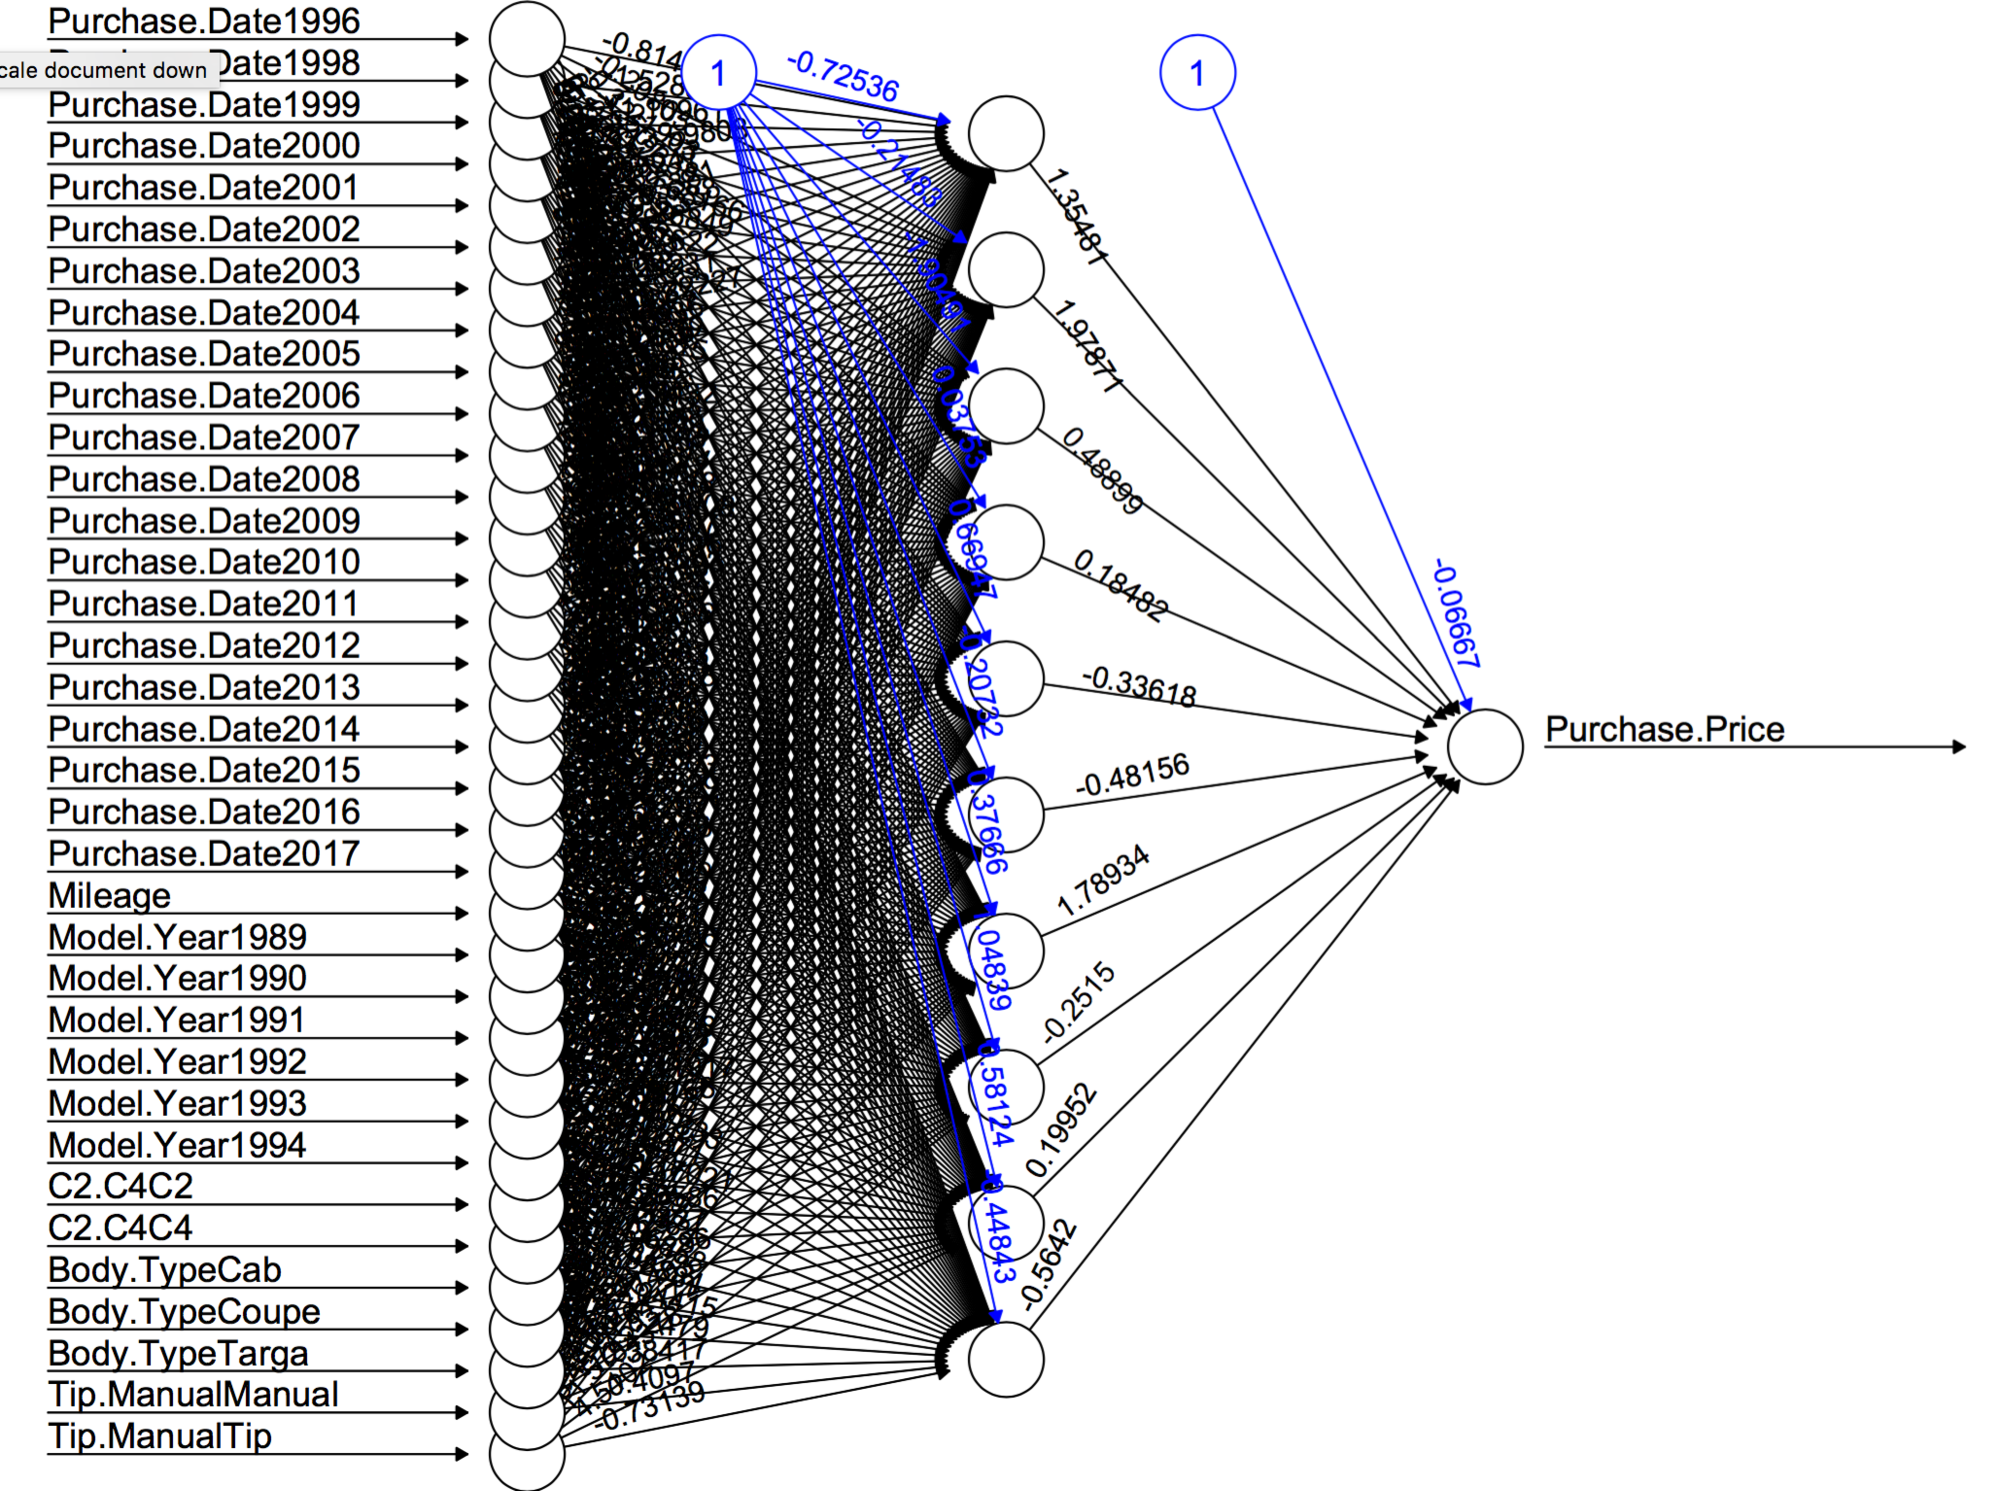
In addition to the above, I created three neural nets just to show the graph of the model...you guys are free to interpret them as you see fit.
The formatting of that last one got away from me. I will try and fix the purchase date as a discrete variable issue and see if we can actually use a neural net to predict the price.
If you would like to see how accurate the multiple regression is please post info about your car including year purchased, mileage when purchased, drivetrain, transmission, body style and model year and I will calculate what the model predicts you paid for it. It's up to you if you want to share purchase price.
If you would like to see how accurate the multiple regression is please post info about your car including year purchased, mileage when purchased, drivetrain, transmission, body style and model year and I will calculate what the model predicts you paid for it. It's up to you if you want to share purchase price.
Great work. This is all way to complicated for me to understand but lets give it a go!
purchased in 2017
72k miles
c2
tiptronic
coupe
1991
Very nicely done! Data Science and Statistics are truly fascinating. I'm a geophysicist by training, but would love to dive more in to these types of studies in my spare time. I wonder if the overall distribution would be log-normal? Although there is a lot of scatter, the last Purchase Price vs. Mileage plot might suggest that it is? I think one distinction which could be made is that the average price is averaged out over all sales dating back to when the cars were initially sold? So it makes sense that the average is lower than what we are currently seeing now. You handle the recent with your trend plots for the last 3 or so years.
What type of Neural Net are you using, out of curiosity? Kohonen Self-Organizing Maps? It looks like you are feeding the NN the various "attributes" of the cars you are tracking, but I'm not sure what the hidden layers are saying about the natural clusters in the data.
Your box chart is very cool. Kinda looks like a stock price chart. I don't know what level of granularity you can get to, but it would be interesting to see if you could perform some spectral decomposition treating the data as a discrete time series to see if you can break out short- and long-terms wavelengths or trends - just an idea. Or maybe some simple running averages?
Anyway, very cool! I like seeing these kinds of things.
As for my car -
Purchased: July 2014
Mileage: ~ 107,000 miles
C2
Manual
Coupe
1991
And if color has any impact on your model, it is Guards Red / Cashmere Beige
That is insane, clearly you’re doing this type of work for a living...or maybe hobby!
I wonder if there are other places we can pull prices from that would help make the data more complete. Perhaps someone has access to auction house prices etc?
[QUOTE=sooner964;14882519]Very nicely done! Data Science and Statistics are truly fascinating. I'm a geophysicist by training, but would love to dive more in to these types of studies in my spare time. I wonder if the overall distribution would be log-normal? Although there is a lot of scatter, the last Purchase Price vs. Mileage plot might suggest that it is? I think one distinction which could be made is that the average price is averaged out over all sales dating back to when the cars were initially sold? So it makes sense that the average is lower than what we are currently seeing now. You handle the recent with your trend plots for the last 3 or so years.
What type of Neural Net are you using, out of curiosity? Kohonen Self-Organizing Maps? It looks like you are feeding the NN the various "attributes" of the cars you are tracking, but I'm not sure what the hidden layers are saying about the natural clusters in the data.
Your box chart is very cool. Kinda looks like a stock price chart. I don't know what level of granularity you can get to, but it would be interesting to see if you could perform some spectral decomposition treating the data as a discrete time series to see if you can break out short- and long-terms wavelengths or trends - just an idea. Or maybe some simple running averages?
Anyway, very cool! I like seeing these kinds of things.
As for my car -
Purchased: July 2014
Mileage: ~ 107,000 miles
C2
Manual
Coupe
1991
And if color has any impact on your model, it is Guards Red / Cashmere Beige[
/QUO
Geophysics? I'm pretty sure you know more about the models than me!
I would like to treat the data set as a time series...I think that would give much more accurate predictions. I might have gotten to that last night but it was getting late. I will have to look up which neural networks I'm using when I get home.
The model predicts the price of your car as $26,543 which I'm going to guess is too low. I think that is the impact of including all of the data versus just recent data.
For example - the model showed only 2017 and 2018 purchase dates as significant and uses the following coefficients:
2014 - $3,044
2015 - $10,000
2016 - $9,135
2017 - $23,401
2018 - $25,652.
Clearly it skews upward towards the end but probably underweights older but recent sales.
That is insane, clearly you�re doing this type of work for a living...or maybe hobby!
I wonder if there are other places we can pull prices from that would help make the data more complete. Perhaps someone has access to auction house prices etc?
I'm not doing it for a living....yet.
Better data would definitely make it more accurate. One of the common critiques my first go through is that the data ignores a lot of private sales and auction houses which tend to be higher priced. It's a very fair critique I just don't have access to that data.
Very nicely done! Data Science and Statistics are truly fascinating. I'm a geophysicist by training, but would love to dive more in to these types of studies in my spare time. I wonder if the overall distribution would be log-normal? Although there is a lot of scatter, the last Purchase Price vs. Mileage plot might suggest that it is? I think one distinction which could be made is that the average price is averaged out over all sales dating back to when the cars were initially sold? So it makes sense that the average is lower than what we are currently seeing now. You handle the recent with your trend plots for the last 3 or so years.
What type of Neural Net are you using, out of curiosity? Kohonen Self-Organizing Maps? It looks like you are feeding the NN the various "attributes" of the cars you are tracking, but I'm not sure what the hidden layers are saying about the natural clusters in the data.
Your box chart is very cool. Kinda looks like a stock price chart. I don't know what level of granularity you can get to, but it would be interesting to see if you could perform some spectral decomposition treating the data as a discrete time series to see if you can break out short- and long-terms wavelengths or trends - just an idea. Or maybe some simple running averages?
Anyway, very cool! I like seeing these kinds of things.
As for my car -
Purchased: July 2014
Mileage: ~ 107,000 miles
C2
Manual
Coupe
1991
And if color has any impact on your model, it is Guards Red / Cashmere Beige[
/QUO
Geophysics? I'm pretty sure you know more about the models than me!
I would like to treat the data set as a time series...I think that would give much more accurate predictions. I might have gotten to that last night but it was getting late. I will have to look up which neural networks I'm using when I get home.
The model predicts the price of your car as $26,543 which I'm going to guess is too low. I think that is the impact of including all of the data versus just recent data.
For example - the model showed only 2017 and 2018 purchase dates as significant and uses the following coefficients:
2014 - $3,044
2015 - $10,000
2016 - $9,135
2017 - $23,401
2018 - $25,652.
Clearly it skews upward towards the end but probably underweights older but recent sales.
I think you are headed in the right direction! This is really great work that you are contributing to our forum, and I love it! I wonder if this could somehow be turned in to a paper for a peer-reviewed journal? This would be not only applicable to our cars, but any car that would be a collectible some day. The model parameters would be different, of course, but the over all idea is transferable. It may even be transferable to anything that could be considered as a similar "investment", if you will.
The model is a little low for my car, but not by much. I paid right around $30k for mine when I got it, and probably could have gotten it for a little less if I had really tried, but I felt like I was already at a fair price. I bought right before the market for 964's really exploded, so I am probably at a hinge-point for the model, which might be difficult to accurately predict. At the time, 3.2's were still sub $30k cars and SC's were in the mid to low $20's... The longhood 912's were actually still pretty cheap then, too.
What might be interesting to examine is whether we (in the general sense) are more or less approaching an upward asymptotic limit for values or not.
Another interesting parameter that may or may not be in your model is looking at the numbers of 964's produced originally in all the various flavors, and how many are still actually out there. In other words, does the perception that the number of "good" cars is decreasing have a direct impact on the value? Intuitively, we would say yes, but is that really the case? In a similar vein, what effect do people like Singer, RWB, etc. have on the values of "unmolested" 964's? The trick, though, is figuring out how to get those numbers, I'd bet.
That is insane, clearly you�re doing this type of work for a living...or maybe hobby!
I wonder if there are other places we can pull prices from that would help make the data more complete. Perhaps someone has access to auction house prices etc?
The model predicts your purchase price was $9443 using all of the variables and $14,114 using only significant variables. I think this is most likely due to the limited number of targa's included in the dataset.
Thanks 911Jetta. The model includes the sales data from BAT as well as 2015 eBay sales data. If you know how to pull 2016, 2017, and 2018 data from eBay that would greatly increase the data set. Recent data is really comprised of BAT sales and those posted on Rennlist.
Off topic and random question, but Is your username "fftfk" by chance a refence to signal processing techniques? FFT - Fast Fourier Transform, and FK - Frequency-Wavenumber analysis?

 03-20-2018, 12:39 AM