When you click on links to various merchants on this site and make a purchase, this can result in this site earning a commission. Affiliate programs and affiliations include, but are not limited to, the eBay Partner Network.
Since the gSum is a measure that is made up from the quality of the three individual inputs of the driver, improving each of these individual inputs would be the best way to insure that you are closest to optimum.
That would take a simulation program. Bosch or ChassisSim would be good. I use OptimumLap.
__________________ -Peter Krause www.peterkrause.net www.gofasternow.com
"Combining the Art and Science of Driving Fast!"
Specializing in Professional, Private Driver Performance Evaluation and Optimization
Consultation Available Remotely and at VIRginia International Raceway
Since the gSum is a measure that is made up from the quality of the three individual inputs of the driver, improving each of these individual inputs would be the best way to insure that you are closest to optimum.
That would take a simulation program. Bosch or ChassisSim would be good. I use OptimumLap.
ok
i have been working with optimumlap also. Would love better cars as defoult hard to know grip and df level of my race car
Didn't even know you could do that in that software. Tim is a great guy and the best support around for that system, for sure.
Indeed you can. If you have the right security keys, the bottom portion of the display is programmable. This is a feature that isn't talked about much and there is a lot of hidden capability. For a couple of samples, see this page:
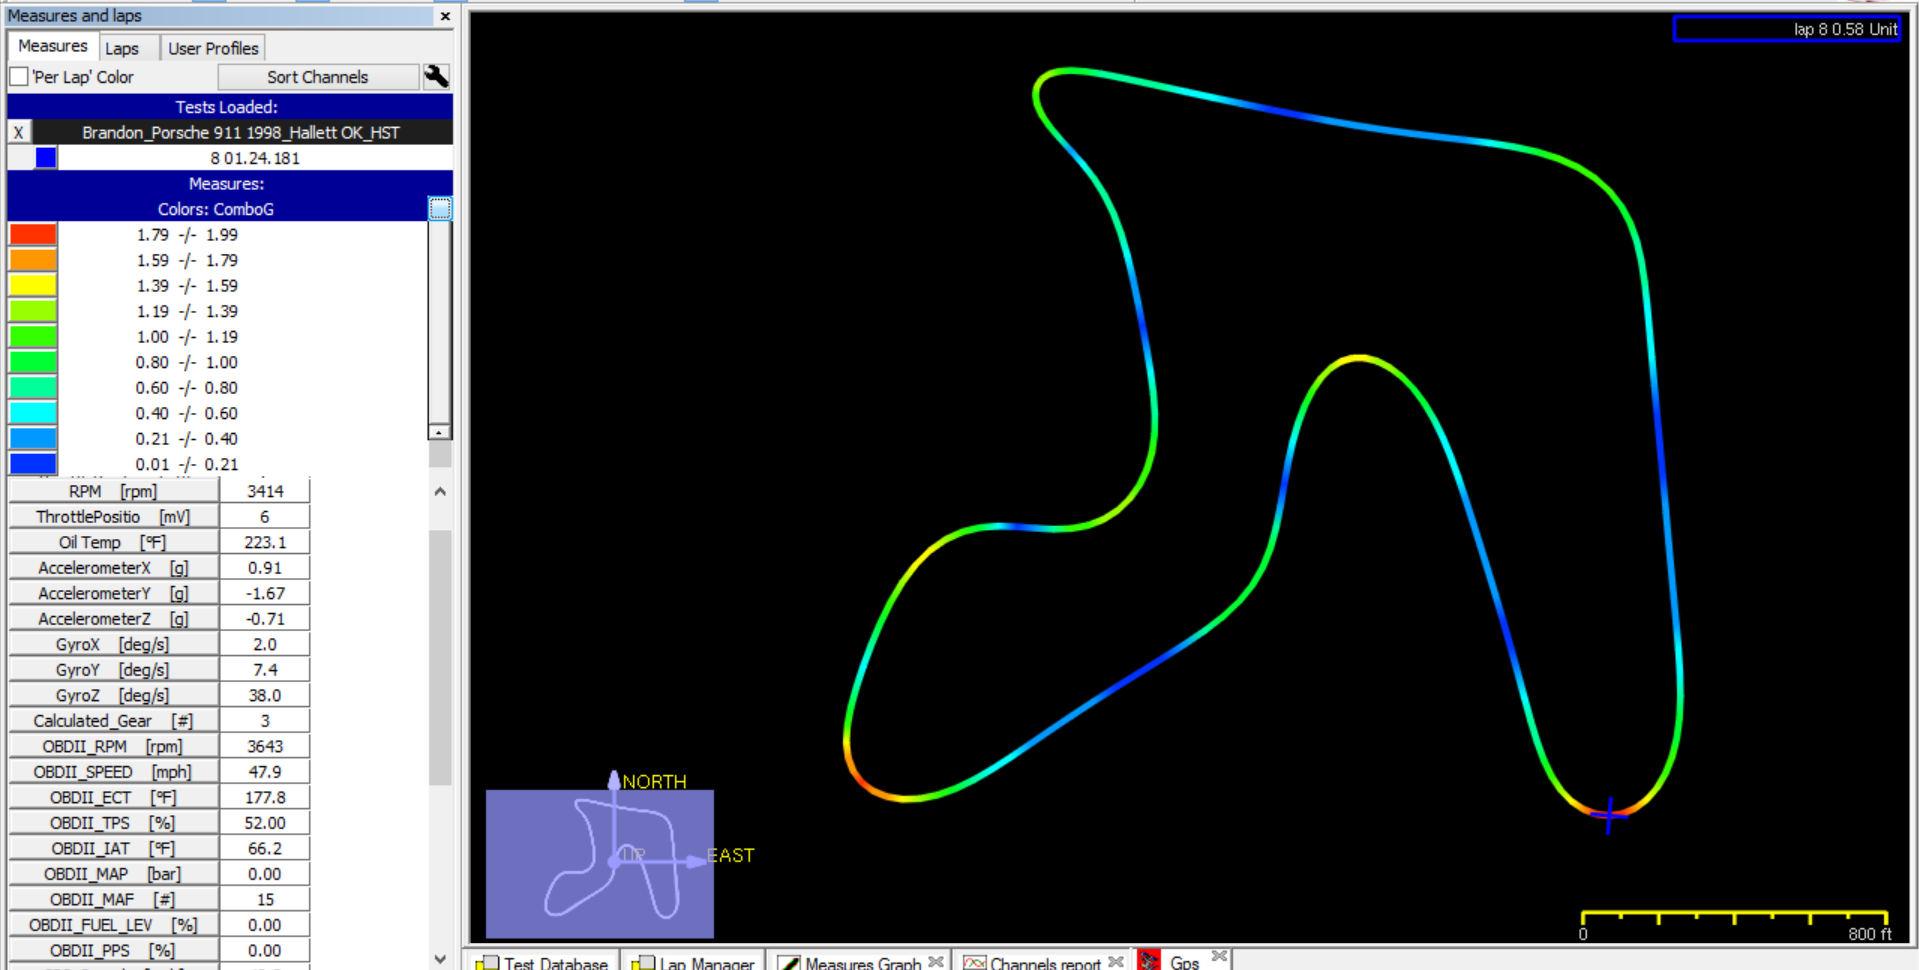
Remember that the Gsum is really the same info as in a G-G diagram (friction circle). Sometimes it's helpful to use the G-G diagram to walk through a corner to see where the data comes off the theoretical outside of the graph and into the middle.
Since this discussion has been so incredibly informative, I offer myself up as a test subject to dive a little deeper.
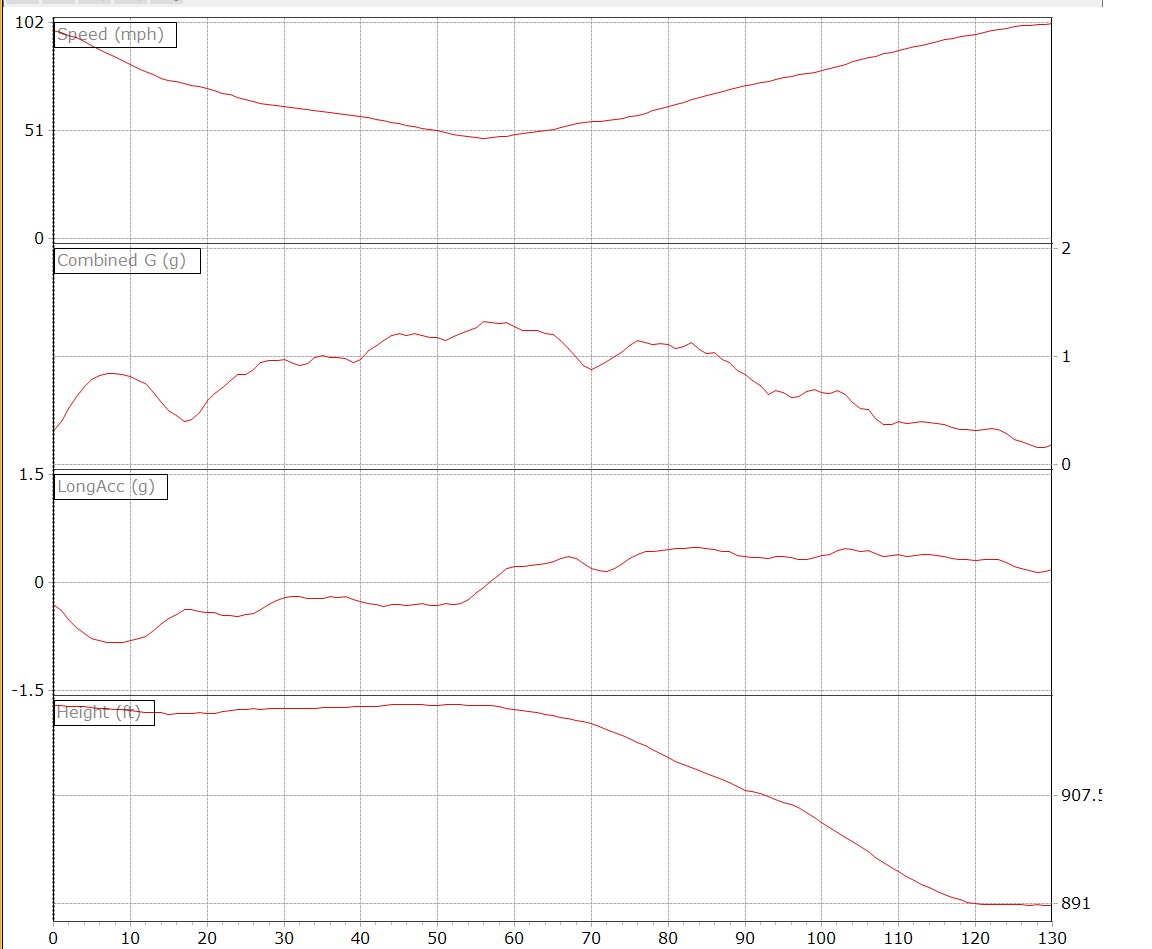
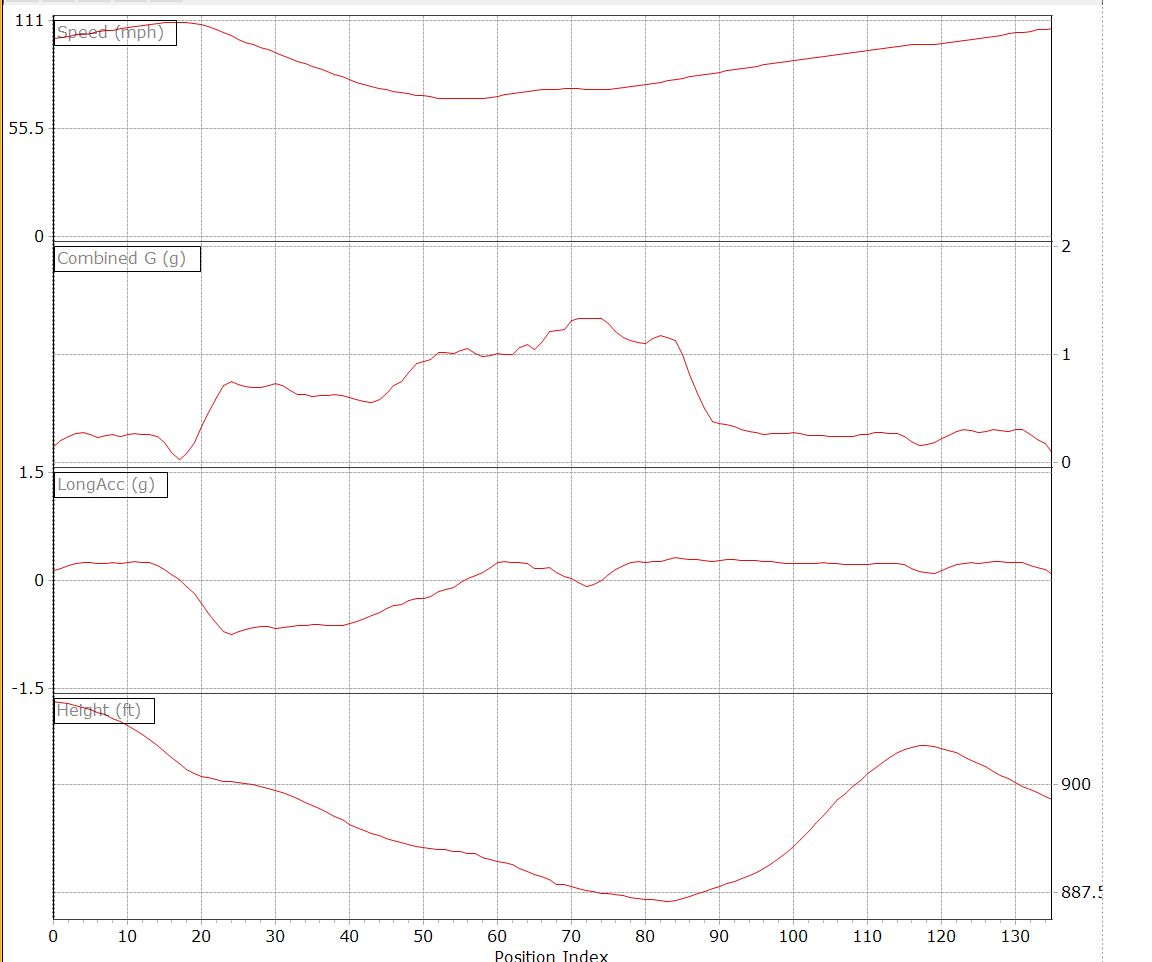
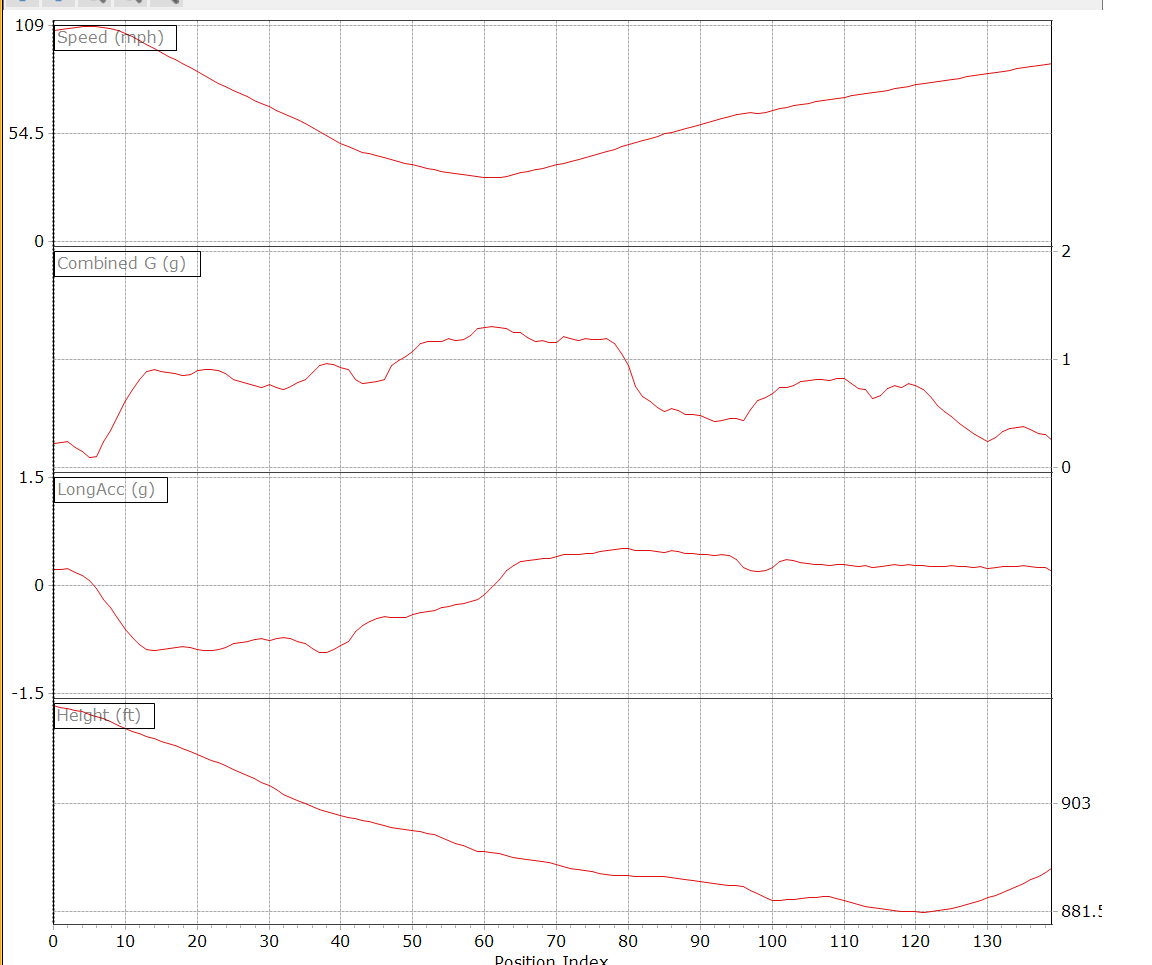
Below are three graphs from Hallet, CCW. They include #10 which is a medium speed corner, #1 which is fast and #2 which is slow. #10 is marked by the cursor on the heat map with 1 and 2 immediately after it. I've analyzed these backwards and forwards and think I know what I need to do to improve them but would be very interested in finding out what I "should" be seeing in them.
One interesting note is the difference in the values reported between CT and RS.
Thank you Peter! I was close on the formula, but not quite there.
While the visual confirms what the data and video (plus my brain) have been telling me it is a new tool to build the confidence to get deeper into the brake zone. And for me that is regardless of the car being driven. There is a slight drop in g between brake release and max cornering g loads that simply needs to go away. Something to work on next season is keeping that g load consistent from the beginning of the brake zone to the point of being back to 100% throttle. The visual representation of the data shows very clearly the tires can take it.
Good stuff! A great learning tool.
Glad that worked out, Rob. With the resources you have at your disposal, this is another VERY powerful arrow in the quiver. A little surprised this hasn't been a mainstay in your work at the track before this, but now you know!

 11-27-2016, 07:06 PM