Tracking sector data
 11-26-2016, 12:41 PM
#31
Rennlist Member
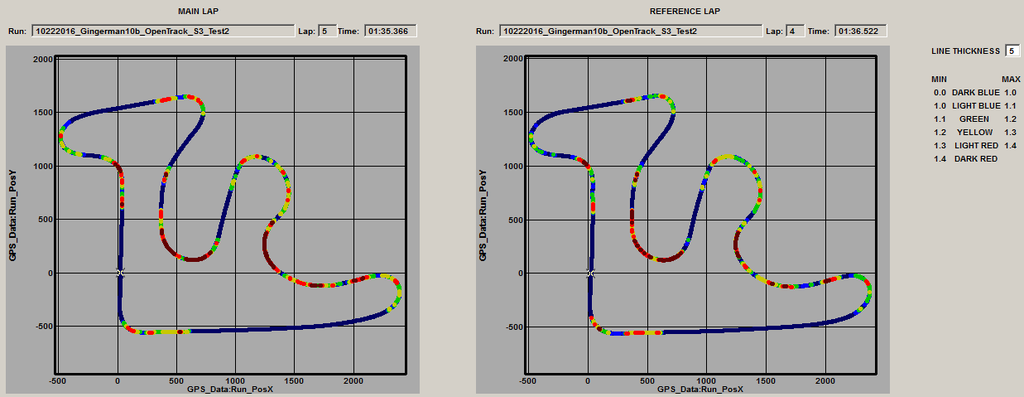
Why 1,4..?
Here is a new printscreen Attachment 1111495
Looks better if i understand it right i need to work on my braking before turn 5 and keep the speed up in some corners
Here is a new printscreen Attachment 1111495
Looks better if i understand it right i need to work on my braking before turn 5 and keep the speed up in some corners
 11-26-2016, 02:04 PM
#32
Rennlist
Basic Site Sponsor
Basic Site Sponsor
Join Date: Jun 2008
Location: Durham, NC and Virginia International Raceway
Posts: 18,692
Received 2,850 Likes
on
1,676 Posts
The reason why 1.4 is because for this measure to be useful, it must not measure only the peaks, but a high, sustainable (and sustained) value. Too many variations around peak value and the colored map is too variegated to help you. You MUST see the high sustained value on the graph first and and extend it to the color bars on the map.
This, of course, would be a lower value for DOT-R or street tires than for slicks.
There are also ways to gate this measure to remove the aero advantage and quantify mechanical grip, but only in i2Pro. That's another class, entirely.
This, of course, would be a lower value for DOT-R or street tires than for slicks.
There are also ways to gate this measure to remove the aero advantage and quantify mechanical grip, but only in i2Pro. That's another class, entirely.
__________________
-Peter Krause
www.peterkrause.net
www.gofasternow.com
"Combining the Art and Science of Driving Fast!"
Specializing in Professional, Private Driver Performance Evaluation and Optimization
Consultation Available Remotely and at VIRginia International Raceway
-Peter Krause
www.peterkrause.net
www.gofasternow.com
"Combining the Art and Science of Driving Fast!"
Specializing in Professional, Private Driver Performance Evaluation and Optimization
Consultation Available Remotely and at VIRginia International Raceway
11-26-2016, 03:39 PM
#33
Rennlist Member
Slight tangent perhaps...
From what I can tell so far, RaceLogic really does a better job with GPS position data than the AIM SoloDL that I was using previously. I mean it seems more practical to overlay position traces from the VBOX HD2 on a track satellite image to see how line varies lap to lap when comparing.
CT does not however seem to have the data driven colored track display. It occurs to me to wonder: would not RaceLogic have soemthing unique and valuable if they combined the ability to show you exactly where you were on the track with the datum value at that point?? In the context of this GSum conversation it might allow you to look directly at variation in line and what that does to your ability to use the tire grip completely??
I'd love to see the colored track map in CT...might this additional point about exact line give them more incentive to add it for us since it might be a differentiator?? If this sounds like a good idea I'm sure RL would listen to experts more than a random user
11-27-2016, 10:32 AM
#35
Rennlist
Basic Site Sponsor
Basic Site Sponsor
Join Date: Jun 2008
Location: Durham, NC and Virginia International Raceway
Posts: 18,692
Received 2,850 Likes
on
1,676 Posts
What AIM do you have? Using GPS or do you have a dash?
11-27-2016, 10:36 AM
#36
Rennlist
Basic Site Sponsor
Basic Site Sponsor
Join Date: Jun 2008
Location: Durham, NC and Virginia International Raceway
Posts: 18,692
Received 2,850 Likes
on
1,676 Posts
Slight tangent perhaps...
From what I can tell so far, RaceLogic really does a better job with GPS position data than the AIM SoloDL that I was using previously. I mean it seems more practical to overlay position traces from the VBOX HD2 on a track satellite image to see how line varies lap to lap when comparing.
CT does not however seem to have the data driven colored track display. It occurs to me to wonder: would not RaceLogic have soemthing unique and valuable if they combined the ability to show you exactly where you were on the track with the datum value at that point?? In the context of this GSum conversation it might allow you to look directly at variation in line and what that does to your ability to use the tire grip completely??
I'd love to see the colored track map in CT...might this additional point about exact line give them more incentive to add it for us since it might be a differentiator?? If this sounds like a good idea I'm sure RL would listen to experts more than a random user
From what I can tell so far, RaceLogic really does a better job with GPS position data than the AIM SoloDL that I was using previously. I mean it seems more practical to overlay position traces from the VBOX HD2 on a track satellite image to see how line varies lap to lap when comparing.
CT does not however seem to have the data driven colored track display. It occurs to me to wonder: would not RaceLogic have soemthing unique and valuable if they combined the ability to show you exactly where you were on the track with the datum value at that point?? In the context of this GSum conversation it might allow you to look directly at variation in line and what that does to your ability to use the tire grip completely??
I'd love to see the colored track map in CT...might this additional point about exact line give them more incentive to add it for us since it might be a differentiator?? If this sounds like a good idea I'm sure RL would listen to experts more than a random user
11-27-2016, 11:44 AM
#38
Rennlist Member
Thread Starter
Originally Posted by ProCoach
Then, make sure the red zones are consistent and work to prevent dips or gaps below that measure in entire braking zones, near the end of braking zones and between the end of braking zone and max lateral cornering load.
11-27-2016, 12:01 PM
#39
Rennlist
Basic Site Sponsor
Basic Site Sponsor
Join Date: Jun 2008
Location: Durham, NC and Virginia International Raceway
Posts: 18,692
Received 2,850 Likes
on
1,676 Posts
 11-27-2016, 12:07 PM
#40
Rennlist
Basic Site Sponsor
Basic Site Sponsor
Join Date: Jun 2008
Location: Durham, NC and Virginia International Raceway
Posts: 18,692
Received 2,850 Likes
on
1,676 Posts
Maintenance throttle is fine, for a short time and IF the tires are fully loaded (i.e. you are at a high, sustained gSum reading ALL the way through from application of brakes to corner exit, look at the lat g to confirm).
The problem is that EVERY driver's up and down amplitude swings of g loadings, especially gSum, are a) too big and b) too frequent.
Throttle issues boil down to two areas, going in or out of the corner. The two challenges most easily validated by a careful study of gSum are:
Maintenance throttle begins too soon going into the corner, causing a momentary, and sometimes extended, drop in gSum BEFORE latG builds to a high sustained level.
Maintenance throttle stays "maintained" in a static state, TOO long coming off the corner, gSum drops abruptly and prematurely...
11-27-2016, 12:37 PM
#41
Rennlist
Basic Site Sponsor
Basic Site Sponsor
Join Date: Jun 2008
Location: Durham, NC and Virginia International Raceway
Posts: 18,692
Received 2,850 Likes
on
1,676 Posts
And yes, my subject's lack of initial brake pressure into 10A at Road Atlanta clearly shows MASSIVE amounts of unused tire potential at the beginning and through nearly ALL the braking zone. Lots of room for improvement here.
11-27-2016, 04:34 PM
#42
Rennlist Member

I agree that you can approximate the colored map by looking for areas with combined G sustained over that 1G reference line (which isn't bad for my stock GT4 on street tires). You can clearly see where the lap progress cursor is I'm about to waste a bunch of tire capability in the braking zone for T6 there :blushes:
I think the colored map is more a intuitive way of getting to the analysis technique you were advocating though -- looking for less than dark red patches in places where you should be sustaining combined G. From a map you can probably immediately see the difference between braking zone "opportunity" and post-turn-in "opportunity" whereas here I have to look at the G trace and at least one other cross-reference to get to the same conclusion.
Turn 6 at RSMP is, according to the local track rats, a "throwaway" turn -- the advice is just get through it any way you can because there's no one line that works better than others... I was just wondering whether a colored map style trace might allow one to figure out if any particular line makes better use of the available grip or not. I'm imaging a map overlay like this only instead of each lap being a different color, being able to look at two laps where each line is colored based on the range-filtered datum value that you talked about in i2Pro and RSA.

FWIW, after looking at data for this session I picked up a lot of time by working on later brake point but more sustained pressure and by taking a much tighter line to the inside -- almost using some of the width of the track as part of the braking zone -- after cribbing what one of the truly fast guys was doing in front of me
Lots of way to figure out what to work on in the end.I agree you don't _need_ colored maps but I just thought RL might be able to do one-better colored maps given their positional precision and that might be valuable for coaching. Perhaps not so much...it was just a thought
11-27-2016, 04:57 PM
#43
Rennlist
Basic Site Sponsor
Basic Site Sponsor
Join Date: Jun 2008
Location: Durham, NC and Virginia International Raceway
Posts: 18,692
Received 2,850 Likes
on
1,676 Posts
Great news, Mark! You're using your new tools well... 
The development engineers and the sales and marketing folks at AiM, Racelogic, Race-Keeper and MoTeC are all tired of hearing from me, hahaha! My solution would certainly incorporate features from each platform, but biased most towards synced video and data, automated and simple operation and maintenance, measures rendered ON the video and, of course, a variety of ways to illustrate measures in visually intuitive ways.
But, engineers are anoraks. They know what THEY know, not always the best way forward in the paddock. So many different needs, and then trying to retain the simplicity that allows rapid assimilation of the information. I know NO system will ever do it all...
We are a LOT closer than we've ever been before, for each system, though. It's all good.
11-27-2016, 06:44 PM
#44

I've been lurking and wanted to say thank you. The ideas presented here sparked some ideas on how I could make the "other guys" data analysis software make a poor man's Gsum contour track map. It took a bit of gating and programming but now I have something that will really help identify areas where available grip might not be utilized to its fullest.
Thanks again.
Thanks again.
11-27-2016, 07:00 PM
#45
Rennlist
Basic Site Sponsor
Basic Site Sponsor
Join Date: Jun 2008
Location: Durham, NC and Virginia International Raceway
Posts: 18,692
Received 2,850 Likes
on
1,676 Posts